Caffeine inhibits glucose transport by binding at the GLUT1 nucleotide-binding site
- PMID: 25715702
- PMCID: PMC4436993
- DOI: 10.1152/ajpcell.00001.2015
Caffeine inhibits glucose transport by binding at the GLUT1 nucleotide-binding site
Abstract
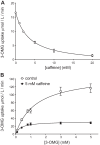
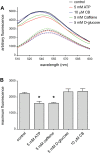
Glucose transporter 1 (GLUT1) is the primary glucose transport protein of the cardiovascular system and astroglia. A recent study proposes that caffeine uncompetitive inhibition of GLUT1 results from interactions at an exofacial GLUT1 site. Intracellular ATP is also an uncompetitive GLUT1 inhibitor and shares structural similarities with caffeine, suggesting that caffeine acts at the previously characterized endofacial GLUT1 nucleotide-binding site. We tested this by confirming that caffeine uncompetitively inhibits GLUT1-mediated 3-O-methylglucose uptake in human erythrocytes [Vmax and Km for transport are reduced fourfold; Ki(app) = 3.5 mM caffeine]. ATP and AMP antagonize caffeine inhibition of 3-O-methylglucose uptake in erythrocyte ghosts by increasing Ki(app) for caffeine inhibition of transport from 0.9 ± 0.3 mM in the absence of intracellular nucleotides to 2.6 ± 0.6 and 2.4 ± 0.5 mM in the presence of 5 mM intracellular ATP or AMP, respectively. Extracellular ATP has no effect on sugar uptake or its inhibition by caffeine. Caffeine and ATP displace the fluorescent ATP derivative, trinitrophenyl-ATP, from the GLUT1 nucleotide-binding site, but d-glucose and the transport inhibitor cytochalasin B do not. Caffeine, but not ATP, inhibits cytochalasin B binding to GLUT1. Like ATP, caffeine renders the GLUT1 carboxy-terminus less accessible to peptide-directed antibodies, but cytochalasin B and d-glucose do not. These results suggest that the caffeine-binding site bridges two nonoverlapping GLUT1 endofacial sites-the regulatory, nucleotide-binding site and the cytochalasin B-binding site. Caffeine binding to GLUT1 mimics the action of ATP but not cytochalasin B on sugar transport. Molecular docking studies support this hypothesis.
Keywords: ATP; GLUT1; caffeine; erythrocyte; glucose transport.
Copyright © 2015 the American Physiological Society.
Figures


Comment in
-
Definitively, my cup of tea. Focus on "Caffeine inhibits glucose transport by binding at the GLUT1 nucleotide-binding site".Am J Physiol Cell Physiol. 2015 May 15;308(10):C825-6. doi: 10.1152/ajpcell.00083.2015. Epub 2015 Mar 25. Am J Physiol Cell Physiol. 2015. PMID: 25810258 Free PMC article. No abstract available.
Similar articles
-
WZB117 (2-Fluoro-6-(m-hydroxybenzoyloxy) Phenyl m-Hydroxybenzoate) Inhibits GLUT1-mediated Sugar Transport by Binding Reversibly at the Exofacial Sugar Binding Site.J Biol Chem. 2016 Dec 23;291(52):26762-26772. doi: 10.1074/jbc.M116.759175. Epub 2016 Nov 11. J Biol Chem. 2016. PMID: 27836974 Free PMC article.
-
Rapid substrate translocation by the multisubunit, erythroid glucose transporter requires subunit associations but not cooperative ligand binding.Biochemistry. 1995 Aug 1;34(30):9762-73. doi: 10.1021/bi00030a014. Biochemistry. 1995. PMID: 7626647
-
Regulation of GLUT1-mediated sugar transport by an antiport/uniport switch mechanism.Biochemistry. 1996 Oct 8;35(40):13231-9. doi: 10.1021/bi961208t. Biochemistry. 1996. PMID: 8855962
-
Human erythrocyte sugar transport is incompatible with available carrier models.Biochemistry. 1996 Aug 13;35(32):10411-21. doi: 10.1021/bi953077m. Biochemistry. 1996. PMID: 8756697
-
Will the original glucose transporter isoform please stand up!Am J Physiol Endocrinol Metab. 2009 Oct;297(4):E836-48. doi: 10.1152/ajpendo.00496.2009. Epub 2009 Aug 18. Am J Physiol Endocrinol Metab. 2009. PMID: 19690067 Free PMC article. Review.
Cited by
-
Power of two: combination of therapeutic approaches involving glucose transporter (GLUT) inhibitors to combat cancer.Biochim Biophys Acta Rev Cancer. 2020 Dec;1874(2):188457. doi: 10.1016/j.bbcan.2020.188457. Epub 2020 Oct 21. Biochim Biophys Acta Rev Cancer. 2020. PMID: 33096154 Free PMC article. Review.
-
SLC2A8 (GLUT8) is a mammalian trehalose transporter required for trehalose-induced autophagy.Sci Rep. 2016 Dec 6;6:38586. doi: 10.1038/srep38586. Sci Rep. 2016. PMID: 27922102 Free PMC article.
-
Kinetic Basis of Cis- and Trans-Allostery in GLUT1-Mediated Sugar Transport.J Membr Biol. 2018 Feb;251(1):131-152. doi: 10.1007/s00232-017-0006-7. Epub 2017 Dec 5. J Membr Biol. 2018. PMID: 29209831 Free PMC article.
-
The regulatory roles and clinical significance of glycolysis in tumor.Cancer Commun (Lond). 2024 Jul;44(7):761-786. doi: 10.1002/cac2.12549. Epub 2024 Jun 8. Cancer Commun (Lond). 2024. PMID: 38851859 Free PMC article. Review.
-
Inhibitor Discovery for the Human GLUT1 from Homology Modeling and Virtual Screening.ACS Chem Biol. 2016 Jul 15;11(7):1908-16. doi: 10.1021/acschembio.6b00304. Epub 2016 May 11. ACS Chem Biol. 2016. PMID: 27128978 Free PMC article.
References
-
- Baker GF, Naftalin RJ. Evidence of multiple operational affinities for d-glucose inside the human erythrocyte membrane. Biochim Biophys Acta 550: 474–484, 1979. - PubMed
Publication types
MeSH terms
Substances
Grants and funding
LinkOut - more resources
Full Text Sources
Other Literature Sources
Medical
Miscellaneous

