

Expression of TGFβ superfamily components and other markers of oocyte quality in oocytes selected by brilliant cresyl blue staining: relevance to early embryonic development
- PMID: 25704641
- PMCID: PMC4407812
- DOI: 10.1002/mrd.22468
Expression of TGFβ superfamily components and other markers of oocyte quality in oocytes selected by brilliant cresyl blue staining: relevance to early embryonic development
Abstract
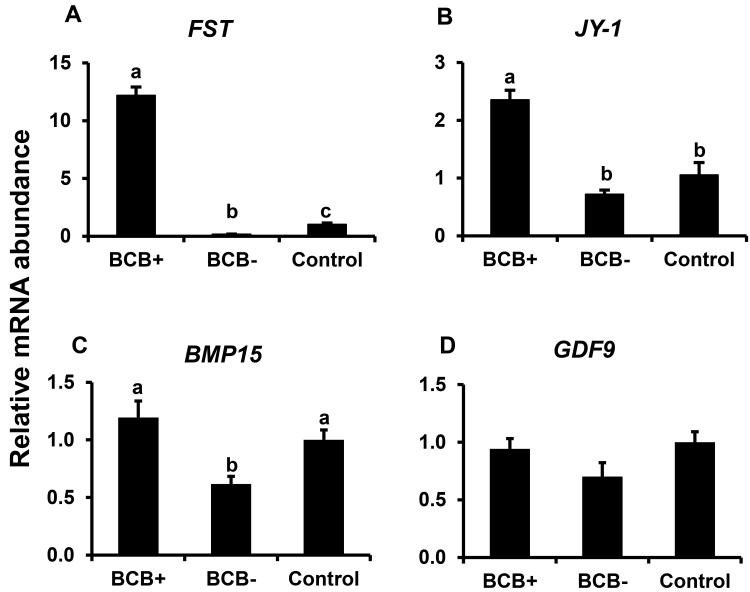
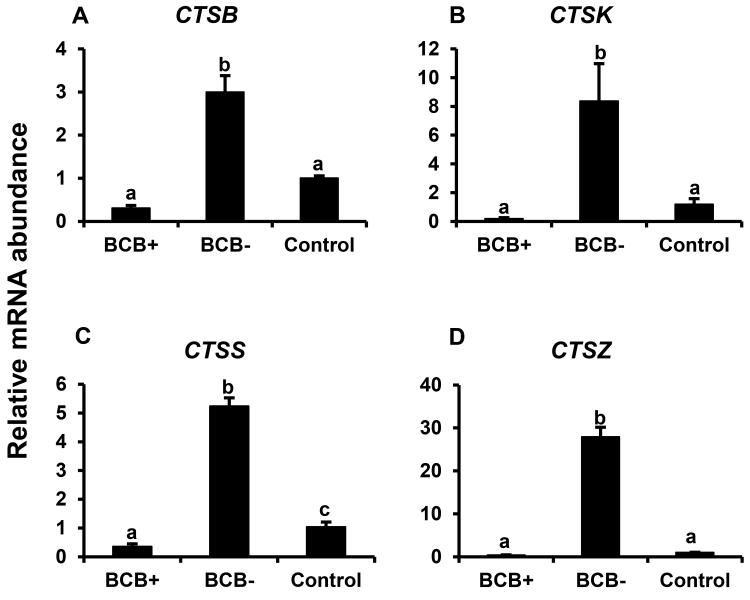
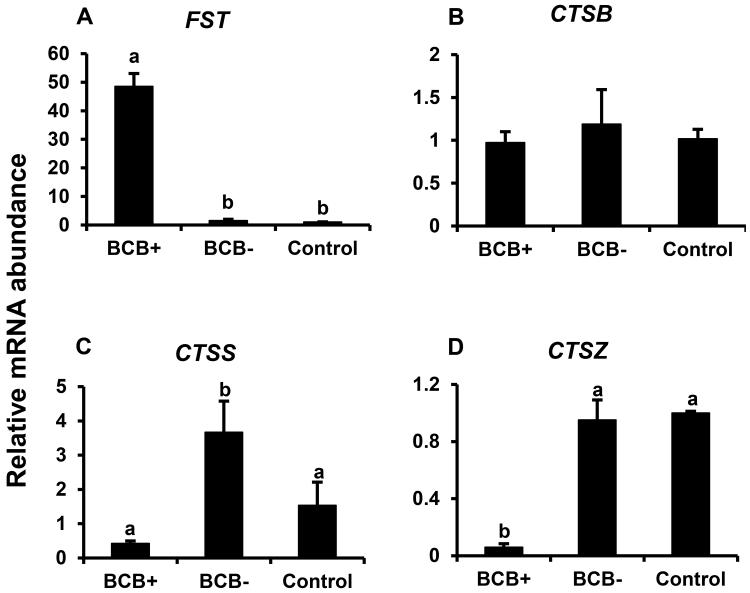
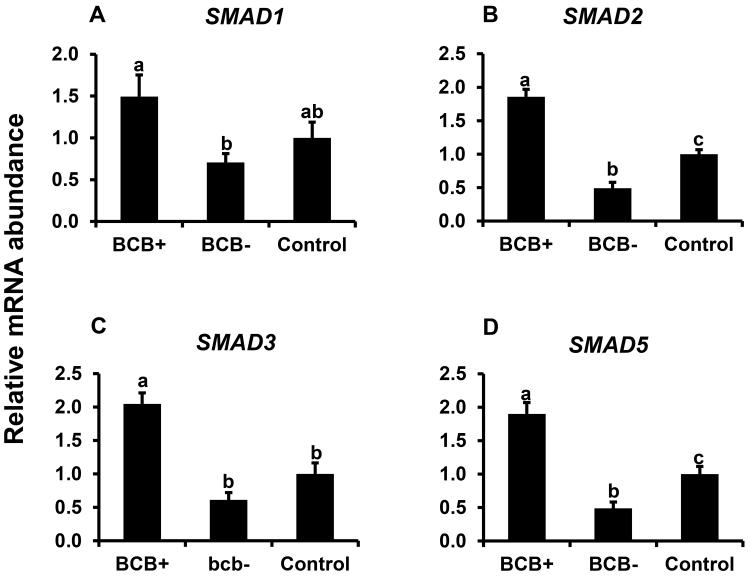
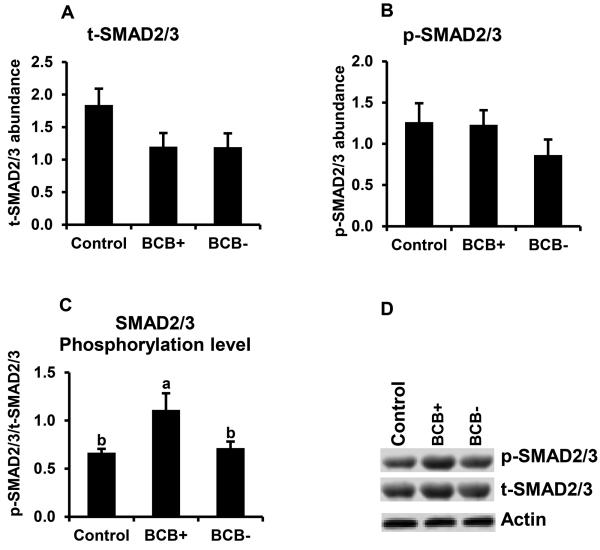
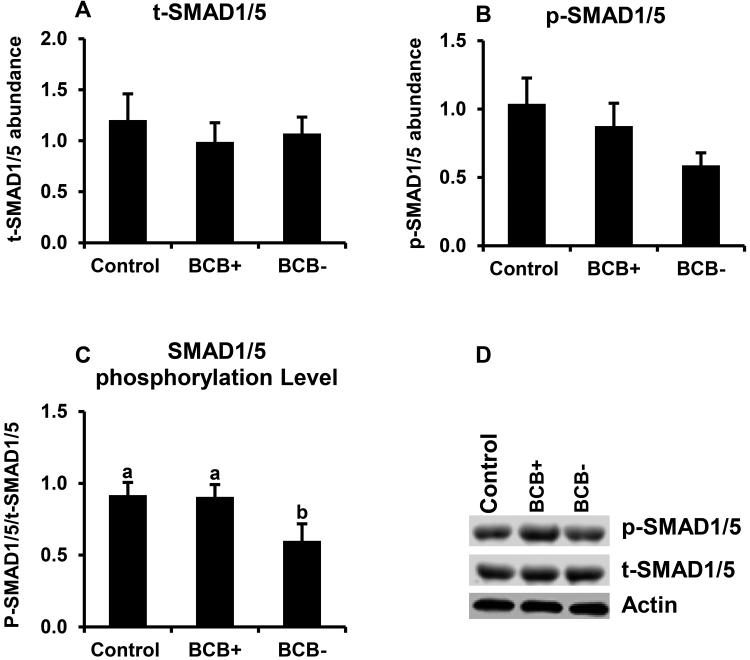
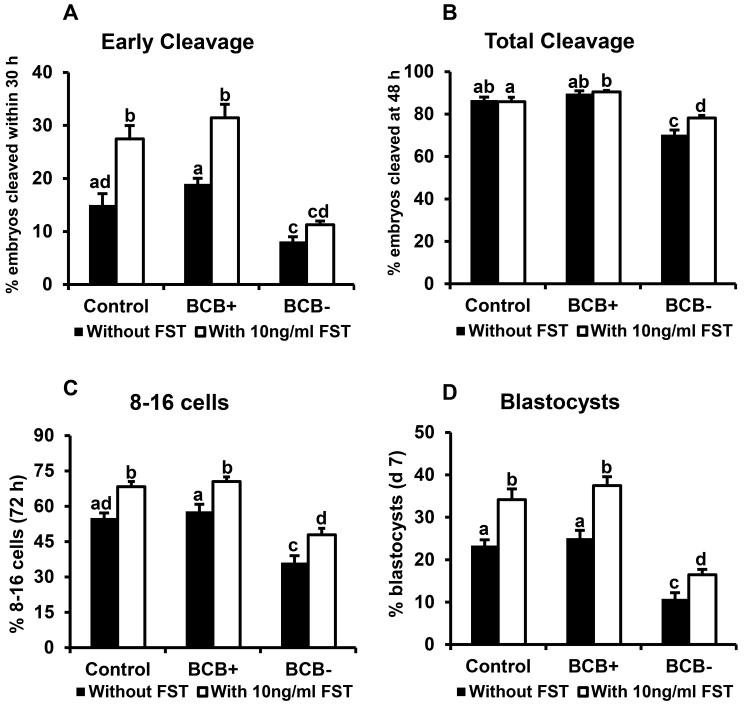
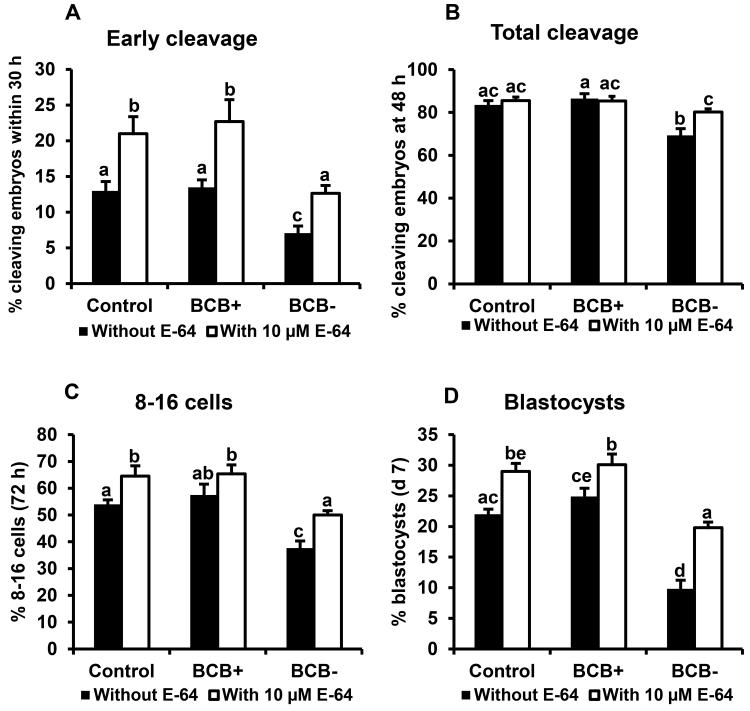
Brilliant cresyl blue (BCB) is a super-vital stain that has been used to select competent oocytes in different species. One objective of the present study was to assess the relationship between BCB staining, which correlates with an oocyte's developmental potential, and the transcript abundance for select TGFβ-superfamily components, SMAD2/3 and SMAD1/5 phosphorylation levels, and oocyte (JY1) and cumulus-cell (CTSB, CTSK, CTSS, and CTSZ) transcript markers in bovine oocytes and/or adjacent cumulus cells. The capacity of exogenous follistatin or JY1 supplementation or cathepsin inhibitor treatment to enhance development of embryos derived from low-quality oocytes, based on BCB staining, was also determined. Cumulus-oocyte complexes (COCs) from abattoir-derived ovaries were subjected to BCB staining, and germinal-vesicle-stage oocytes and cumulus cells were harvested from control, BCB+, and BCB- (low-quality oocyte) groups for real-time PCR or Western-blot analysis. Remaining COCs underwent in vitro maturation, in vitro fertilization, and embryo culture in the presence or absence of the above exogenous supplements. Levels of FST, JY1, BMP15, and SMAD1, 2, 3, and 5 transcripts were higher in BCB+ oocytes whereas CTSB, CTSK, CTSS, and CTSZ mRNA abundance was higher in cumulus cells surrounding BCB- oocytes. Western-blot analysis revealed higher SMAD1/5 and SMAD2/3 phosphorylation in BCB+ than BCB- oocytes. Embryo-culture studies demonstrated that follistatin and cathepsin inhibitor treatment, but not JY-1 treatment, improve the developmental competence of BCB- oocytes. These results contribute to a better understanding of molecular indices of oocyte competence.
© 2015 Wiley Periodicals, Inc.
Figures
Similar articles
-
Gene Expression of Monocarboxylate Transporters and Oocyte-secreted Factors in Bovine Cumulus-oocyte Complexes Selected by Brilliant Cresyl Blue.Reprod Domest Anim. 2015 Oct;50(5):763-70. doi: 10.1111/rda.12585. Epub 2015 Aug 17. Reprod Domest Anim. 2015. PMID: 26280459
-
Developmental competence of Dromedary camel (Camelus dromedarius) oocytes selected using brilliant cresyl blue staining.Zygote. 2017 Aug;25(4):529-536. doi: 10.1017/S0967199417000387. Epub 2017 Jul 11. Zygote. 2017. PMID: 28693630
-
Bovine non-competent oocytes (BCB-) negatively impact the capacity of competent (BCB+) oocytes to undergo in vitro maturation, fertilisation and embryonic development.Zygote. 2016 Apr;24(2):245-51. doi: 10.1017/S0967199415000118. Epub 2015 May 6. Zygote. 2016. PMID: 25943119
-
The utility of Brilliant Cresyl Blue (BCB) staining of mammalian oocytes used for in vitro embryo production (IVP).Reprod Biol. 2013 Sep;13(3):177-83. doi: 10.1016/j.repbio.2013.07.004. Epub 2013 Jul 20. Reprod Biol. 2013. PMID: 24011188 Review.
-
CUMULUS CELL GENES AS POTENTIAL BIOMARKERS OF OOCYTE AND EMBRYO DEVELOPMENTAL COMPETENCE.Fiziol Zh (1994). 2016;62(1):107-13. doi: 10.15407/fz62.01.107. Fiziol Zh (1994). 2016. PMID: 29537212 Review.
Cited by
-
Follistatin supplementation induces changes in CDX2 CpG methylation and improves in vitro development of bovine SCNT preimplantation embryos.Reprod Biol Endocrinol. 2021 Sep 13;19(1):141. doi: 10.1186/s12958-021-00829-7. Reprod Biol Endocrinol. 2021. PMID: 34517901 Free PMC article.
-
Single-cell transcriptome sequencing reveals that cell division cycle 5-like protein is essential for porcine oocyte maturation.J Biol Chem. 2018 Feb 2;293(5):1767-1780. doi: 10.1074/jbc.M117.809608. Epub 2017 Dec 8. J Biol Chem. 2018. PMID: 29222335 Free PMC article.
-
Nobiletin enhances the development and quality of bovine embryos in vitro during two key periods of embryonic genome activation.Sci Rep. 2021 Jun 3;11(1):11796. doi: 10.1038/s41598-021-91158-7. Sci Rep. 2021. PMID: 34083641 Free PMC article.
-
CHD1 Regulates Deposition of Histone Variant H3.3 During Bovine Early Embryonic Development.Biol Reprod. 2016 Jun;94(6):140. doi: 10.1095/biolreprod.116.138693. Epub 2016 May 11. Biol Reprod. 2016. PMID: 27170440 Free PMC article.
-
Follistatin treatment modifies DNA methylation of the CDX2 gene in bovine preimplantation embryos.Mol Reprod Dev. 2020 Sep;87(9):998-1008. doi: 10.1002/mrd.23409. Epub 2020 Aug 10. Mol Reprod Dev. 2020. PMID: 32776625 Free PMC article.
References
-
- Abir R, Fisch B, Johnson MH. BMP15, fertility and the ovary. Reprod BioMed Online. 2014;29(5):525–526. - PubMed
-
- Alm H, Torner H, Lohrke B, Viergutz T, Ghoneim IM, Kanitz W. Bovine blastocyst development rate in vitro is influenced by selection of oocytes by brillant cresyl blue staining before IVM as indicator for glucose-6-phosphate dehydrogenase activity. Theriogenology. 2005;63(8):2194–2205. - PubMed
-
- Balboula AZ, Yamanaka K, Sakatani M, Kawahara M, Hegab AO, Zaabel SM, Takahashi M. Cathepsin B activity has a crucial role in the developmental competence of bovine cumulus-oocyte complexes exposed to heat shock during in vitro maturation. Reproduction. 2013;146(4):407–417. - PubMed
-
- Balemans W, Van Hul W. Extracellular regulation of BMP signaling in vertebrates: a cocktail of modulators. Dev Biol. 2002;250(2):231–250. - PubMed
-
- Barzegari A, Atashpaz S, Ghabili K, Nemati Z, Rustaei M, Azarbaijani R. Polymorphisms in GDF9 and BMP15 associated with fertility and ovulation rate in Moghani and Ghezel sheep in Iran. Reprod Domest Anim. 2010;45(4):666–669. - PubMed
Publication types
MeSH terms
Substances
Grants and funding
LinkOut - more resources
Full Text Sources
Other Literature Sources
Miscellaneous
