

Plant-based oral tolerance to hemophilia therapy employs a complex immune regulatory response including LAP+CD4+ T cells
- PMID: 25700434
- PMCID: PMC4392010
- DOI: 10.1182/blood-2014-08-597070
Plant-based oral tolerance to hemophilia therapy employs a complex immune regulatory response including LAP+CD4+ T cells
Abstract
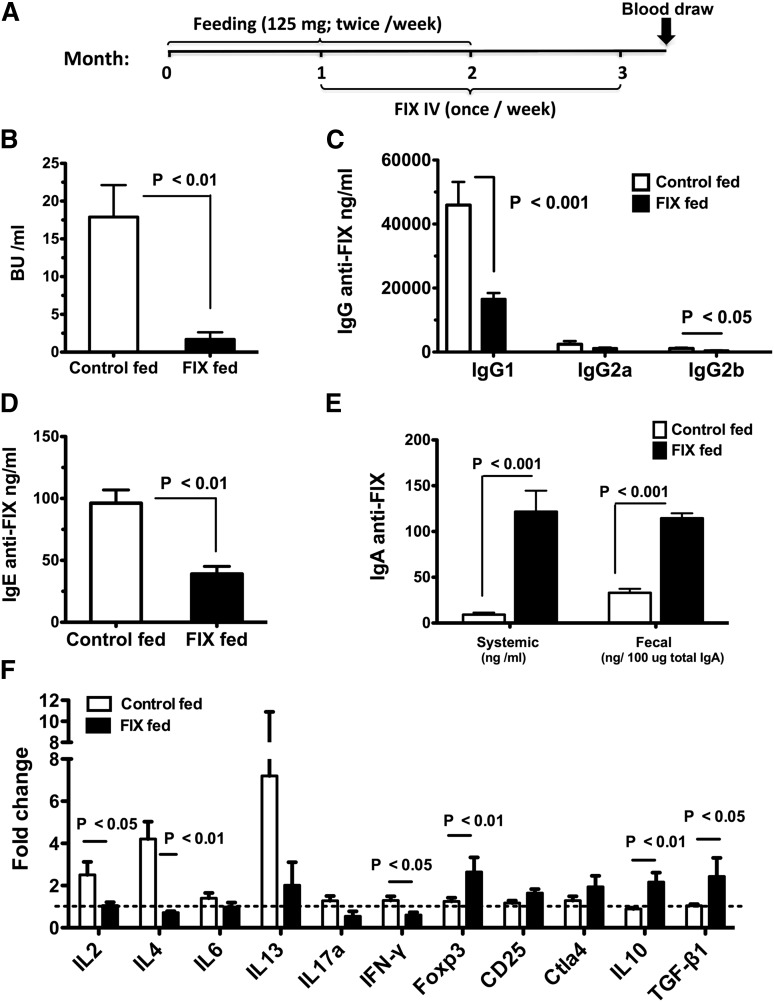
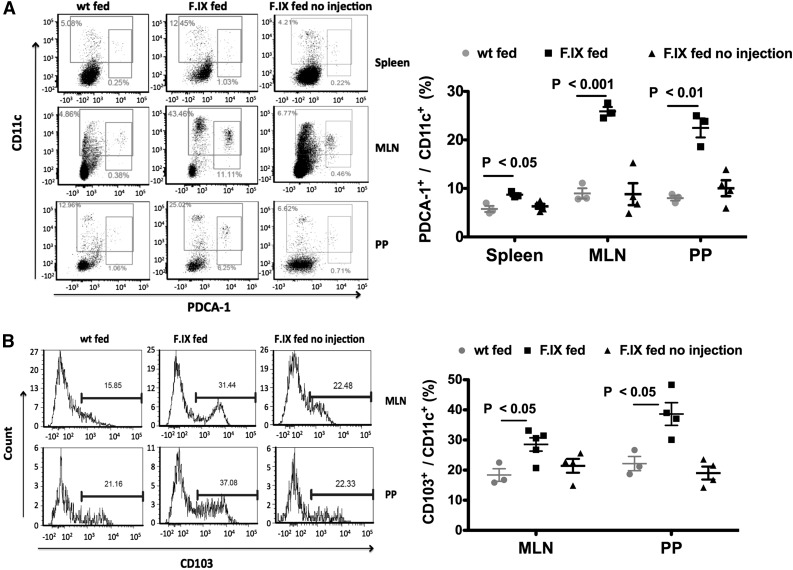
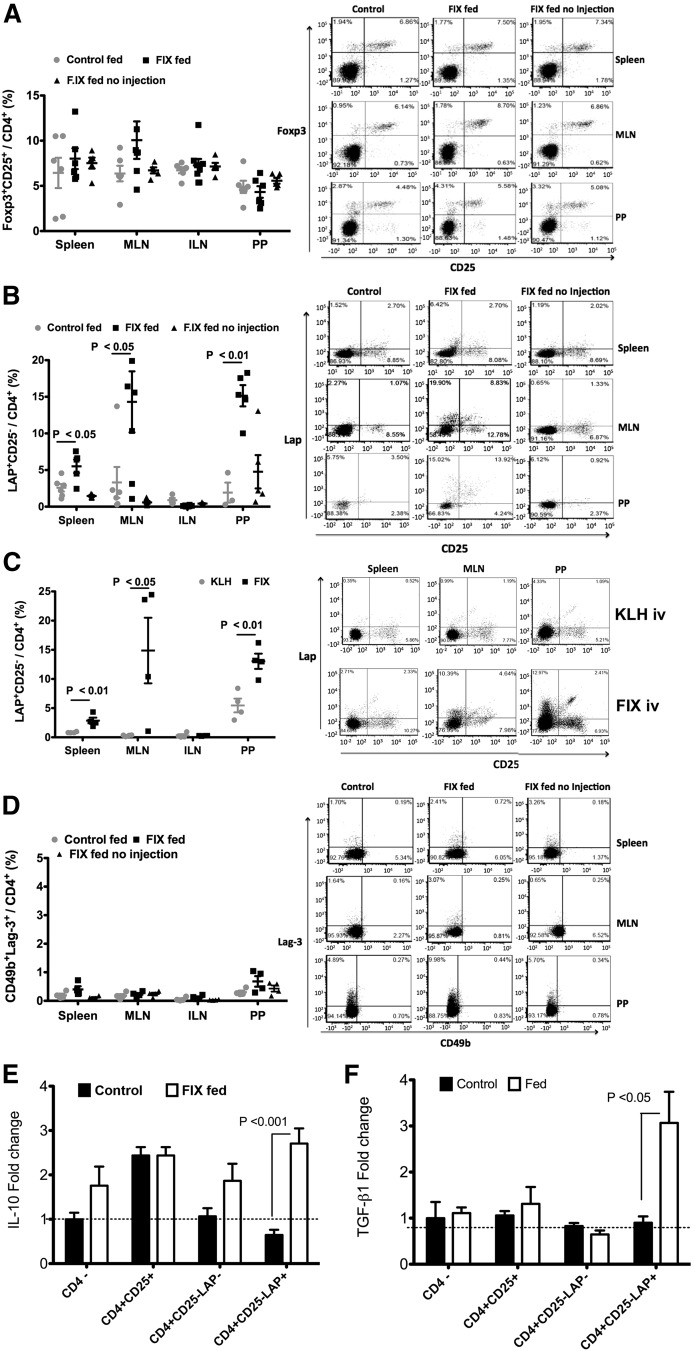
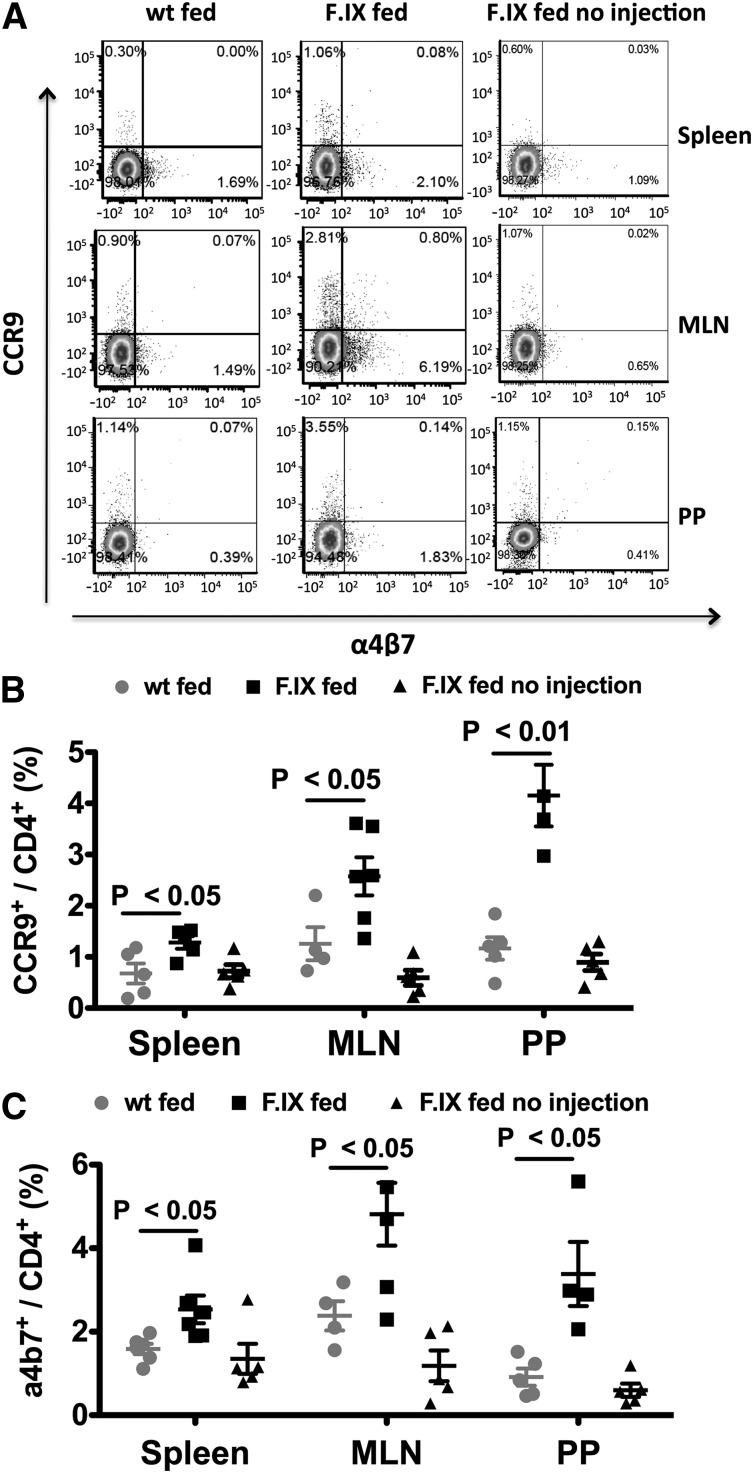
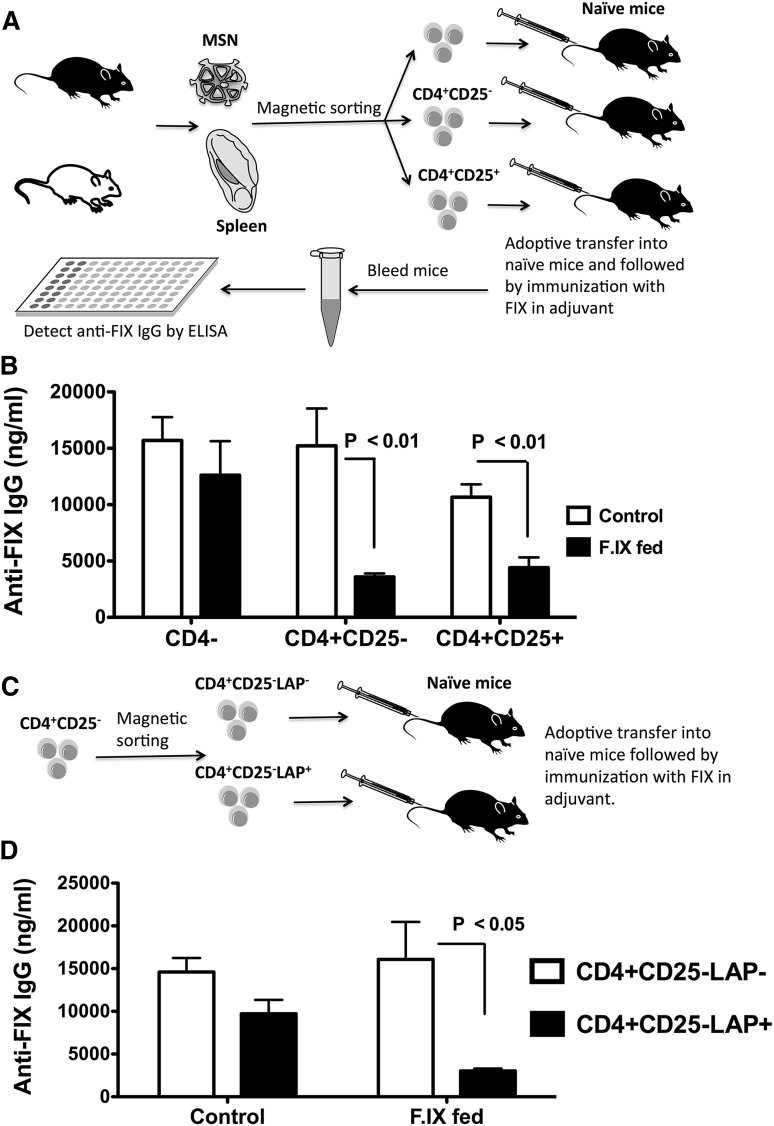
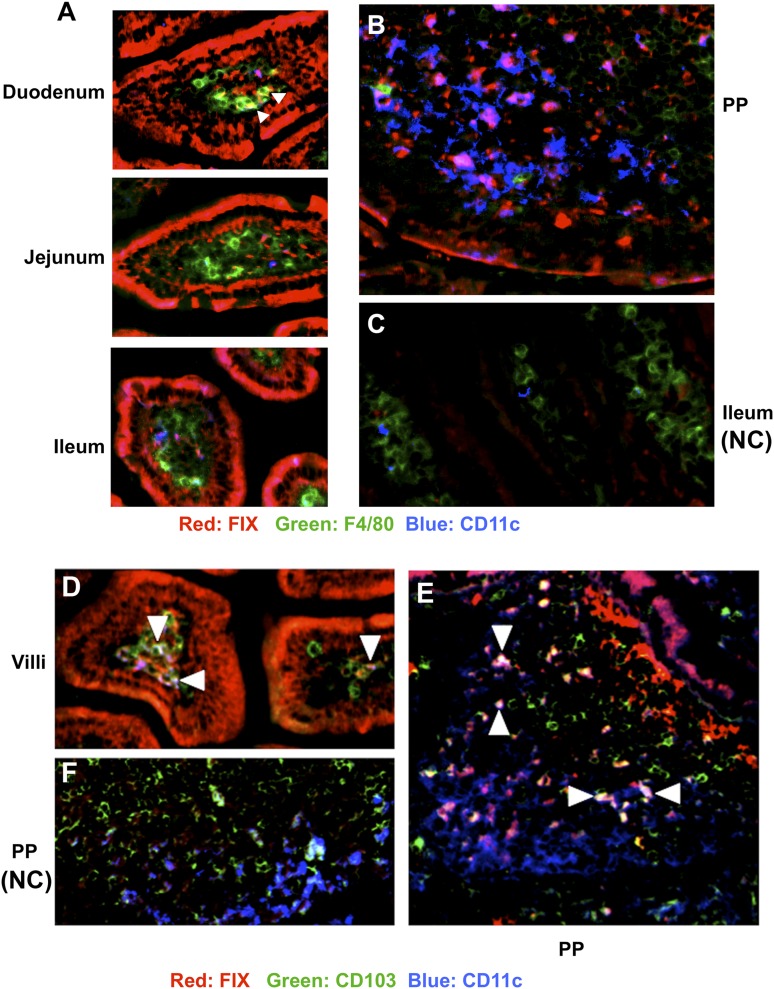
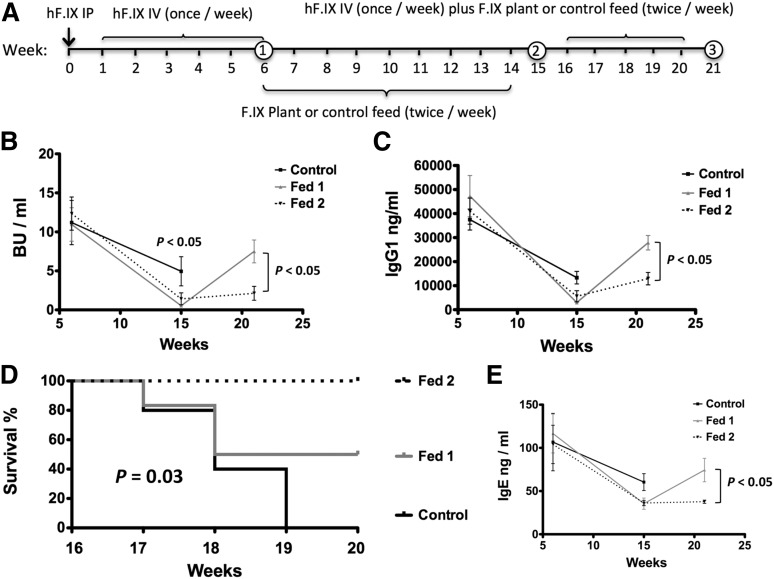
Coagulation factor replacement therapy for the X-linked bleeding disorder hemophilia is severely complicated by antibody ("inhibitor") formation. We previously found that oral delivery to hemophilic mice of cholera toxin B subunit-coagulation factor fusion proteins expressed in chloroplasts of transgenic plants suppressed inhibitor formation directed against factors VIII and IX and anaphylaxis against factor IX (FIX). This observation and the relatively high concentration of antigen in the chloroplasts prompted us to evaluate the underlying tolerance mechanisms. The combination of oral delivery of bioencapsulated FIX and intravenous replacement therapy induced a complex, interleukin-10 (IL-10)-dependent, antigen-specific systemic immune suppression of pathogenic antibody formation (immunoglobulin [Ig] 1/inhibitors, IgE) in hemophilia B mice. Tolerance induction was also successful in preimmune mice but required prolonged oral delivery once replacement therapy was resumed. Orally delivered antigen, initially targeted to epithelial cells, was taken up by dendritic cells throughout the small intestine and additionally by F4/80(+) cells in the duodenum. Consistent with the immunomodulatory responses, frequencies of tolerogenic CD103(+) and plasmacytoid dendritic cells were increased. Ultimately, latency-associated peptide expressing CD4(+) regulatory T cells (CD4(+)CD25(-)LAP(+) cells with upregulated IL-10 and transforming growth factor-β (TGF-β) expression) as well as conventional CD4(+)CD25(+) regulatory T cells systemically suppressed anti-FIX responses.
© 2015 by The American Society of Hematology.
Figures
Similar articles
-
Role of Small Intestine and Gut Microbiome in Plant-Based Oral Tolerance for Hemophilia.Front Immunol. 2020 May 20;11:844. doi: 10.3389/fimmu.2020.00844. eCollection 2020. Front Immunol. 2020. PMID: 32508814 Free PMC article.
-
Oral delivery of bioencapsulated coagulation factor IX prevents inhibitor formation and fatal anaphylaxis in hemophilia B mice.Proc Natl Acad Sci U S A. 2010 Apr 13;107(15):7101-6. doi: 10.1073/pnas.0912181107. Epub 2010 Mar 29. Proc Natl Acad Sci U S A. 2010. PMID: 20351275 Free PMC article.
-
Oral Tolerance Induction in Hemophilia B Dogs Fed with Transplastomic Lettuce.Mol Ther. 2017 Feb 1;25(2):512-522. doi: 10.1016/j.ymthe.2016.11.009. Mol Ther. 2017. PMID: 28153098 Free PMC article.
-
Inhibitor antibodies to factor VIII and factor IX: management.Semin Thromb Hemost. 2000;26(2):179-88. doi: 10.1055/s-2000-9821. Semin Thromb Hemost. 2000. PMID: 10919411 Review.
-
Recombinant FIXFc: a novel therapy for the royal disease?Expert Opin Biol Ther. 2011 Oct;11(10):1361-8. doi: 10.1517/14712598.2011.603304. Epub 2011 Jul 22. Expert Opin Biol Ther. 2011. PMID: 21780945 Review.
Cited by
-
Immunotherapy using algal-produced Ara h 1 core domain suppresses peanut allergy in mice.Plant Biotechnol J. 2016 Jul;14(7):1541-50. doi: 10.1111/pbi.12515. Epub 2016 Jan 23. Plant Biotechnol J. 2016. PMID: 26801740 Free PMC article.
-
Recent advances in hemophilia B therapy.Drug Deliv Transl Res. 2017 Jun;7(3):359-371. doi: 10.1007/s13346-017-0365-8. Drug Deliv Transl Res. 2017. PMID: 28243977 Review.
-
Plant cell-made protein antigens for induction of Oral tolerance.Biotechnol Adv. 2019 Nov 15;37(7):107413. doi: 10.1016/j.biotechadv.2019.06.012. Epub 2019 Jun 26. Biotechnol Adv. 2019. PMID: 31251968 Free PMC article. Review.
-
Targeting Antigen-Specific B Cells Using Antigen-Expressing Transduced Regulatory T Cells.J Immunol. 2018 Sep 1;201(5):1434-1441. doi: 10.4049/jimmunol.1701800. Epub 2018 Jul 18. J Immunol. 2018. PMID: 30021767 Free PMC article.
-
Reprogrammed CD4+ T Cells That Express FoxP3+ Control Inhibitory Antibody Formation in Hemophilia A Mice.Front Immunol. 2019 Feb 20;10:274. doi: 10.3389/fimmu.2019.00274. eCollection 2019. Front Immunol. 2019. PMID: 30842776 Free PMC article.
References
-
- DiMichele DM. Immune tolerance in haemophilia: the long journey to the fork in the road. Br J Haematol. 2012;159(2):123–134. - PubMed
-
- Rawle FE, Pratt KP, Labelle A, Weiner HL, Hough C, Lillicrap D. Induction of partial immune tolerance to factor VIII through prior mucosal exposure to the factor VIII C2 domain. J Thromb Haemost. 2006;4(10):2172–2179. - PubMed
Publication types
MeSH terms
Substances
Grants and funding
LinkOut - more resources
Full Text Sources
Other Literature Sources
Molecular Biology Databases
Research Materials
