. 2015 Feb 20;10(2):e0115533.
doi: 10.1371/journal.pone.0115533. eCollection 2015.

A novel mathematical model describing adaptive cellular drug metabolism and toxicity in the chemoimmune system

Affiliations

A novel mathematical model describing adaptive cellular drug metabolism and toxicity in the chemoimmune system

Attila Tóth et al. PLoS One. .

Abstract

Cells cope with the threat of xenobiotic stress by activating a complex molecular network that recognizes and eliminates chemically diverse toxic compounds. This "chemoimmune system" consists of cellular Phase I and Phase II metabolic enzymes, Phase 0 and Phase III ATP Binding Cassette (ABC) membrane transporters, and nuclear receptors regulating these components. In order to provide a systems biology characterization of the chemoimmune network, we designed a reaction kinetic model based on differential equations describing Phase 0-III participants and regulatory elements, and characterized cellular fitness to evaluate toxicity. In spite of the simplifications, the model recapitulates changes associated with acquired drug resistance and allows toxicity predictions under variable protein expression and xenobiotic exposure conditions. Our simulations suggest that multidrug ABC transporters at Phase 0 significantly facilitate the defense function of successive network members by lowering intracellular drug concentrations. The model was extended with a novel toxicity framework which opened the possibility of performing in silico cytotoxicity assays. The alterations of the in silico cytotoxicity curves show good agreement with in vitro cell killing experiments. The behavior of the simplified kinetic model suggests that it can serve as a basis for more complex models to efficiently predict xenobiotic and drug metabolism for human medical applications.


Conflict of interest statement

Competing Interests: The authors declare that co-author Gergely Szakacs is a PLOS ONE Editorial Board member. This does not alter the authors’ adherence to PLOS ONE Editorial policies and criteria.

Figures

Fig 1
Fig 1. Simplified wiring diagram of the chemoimmune network model.
Modeled interactions of a single xenobiotic (X) with Phase 0-III effector enzymes and regulators. Solid arrows represent transport through membranes or biochemical reactions. Dashed arrows denote regulation including multi-step transcriptional and translational regulation (gray) and more direct interaction (black), such as binding of a drug to nuclear receptors. ABC0 and ABCIII symbolize general Phase 0 and Phase III efflux transporters, respectively. CYP and GST represent a Phase I oxidase (a member of the cytochrome P450 superfamily) and a Phase II GSH transferase, respectively. NR symbolizes a general xenobiotic nuclear receptor, while Nrf2 denotes a specific transcription factor. (GST, ABCIII and Nrf2 are duplicated to increase clarity of the figure. Regulatory arrows are not duplicated.) Letters ‘c’ and ‘e’ indicate cytoplasmic and extracellular localization, respectively. X’c is the CYP-oxidized cytoplasmic metabolite of Xc. X”c is the glutathione-conjugated form of X’c. X’bc represents reactive species produced by normal cell metabolism. X’bc is metabolized by the same pathway as X’c. Negative feedback loops are Xc → NR → CYP —| Xc, X’c (and X’bc) → Nrf2 → GST —| X’c (and X’bc), Xc → NR → ABC0 —| Xc, Xc → NR → Nrf2 → ABC0 —| Xc, where → denotes activation and —| denotes inhibition. Feedforward loops are Xc → NR → GST —| X’c, Xc → NR → ABCIII —| X”c (‘direct’ regulation) and Xc → NR → Nrf2 → GST —| X’c, Xc → NR → Nrf2 → ABCIII —| X”c (‘indirect’ regulation). For the complete wiring diagram with all details see S1 Fig.
Fig 2
Fig 2. Effect of extracellular drug concentration on the level of network components.
Six time course simulations were run from steady state as described in Methods. At t0 = 0 h the addition of drug was simulated by setting the extracellular drug concentration ([Xe]) to a constant positive value between 1 nM and 10 μM. a-c Concentration profile of the cytoplasmic form of the drug ([Xc]), its CYP-oxidized metabolite ([X’c]) and GST-conjugated form ([X”c]). d n(X”e)/n(Xin) ratio, where n(X”e) is the amount of the ABCIII-excreted extracellular form of X” and n(Xin) is the amount of drug intake. (Details of drug intake calculation are provided in S1 Text.) e-h Concentration profile of four key enzymes (ABC0, CYP, GST and ABCIII).
Fig 3
Fig 3. Effect of diffusion rate and ABC0 affinity to drug on the level of network components.
Time course simulations were run from steady states belonging to different parameter sets as described in Methods. The extracellular drug concentration ([Xe]) was set to 75 nM at t0 = 0 h. Parameter values are expressed as multiples of their default value (S3 Table). Concentration profile of Xc, X’c, X”c and the level of ABC0 were plotted. a-d Effect of diffusion rate through membranes. Five simulations were run by setting the diffusion rate constants to different values of four orders of magnitude. e-h Effect of ABC0 affinity to drug (Km). Five simulations were run by setting the Michaelis constant to different values encompassing four orders of magnitude.
Fig 4
Fig 4. Effect of external drug concentration and GST affinity on the level of network components.
Time course simulations were run from steady states belonging to different parameter sets as described in Methods. The Michaelis constants describing the affinity of GST to its substrates (X’c and X’bc) were set to five different values encompassing four orders of magnitude. Parameter values are expressed as multiples of their default value (S3 Table). Concentration profile of Xc, X’c, X”c and the level of ABC0 were plotted. a-d The effect of GST affinity to its substrates (Km values) at lower extracellular xenobiotic concentrations. [Xe] was set to 75 nM at t0 = 0 h. e-h The effect of GST affinity to its substrates at higher extracellular xenobiotic concentrations. [Xe] was set to 300 nM at t0 = 0 h.
Fig 5
Fig 5. Modeling cellular fitness to study cytotoxic effects.
Calculation of cellular fitness by assuming a single toxic compound, X. Cytoplasmic concentration of the drug ([Xc]) was calculated using the time course simulation described in Methods. Critical concentration of Xc ([Xc,crit], dashed yellow line) was defined as the threshold concentration, which must be exceeded to cause cellular damage. Chemical load is defined as a nonlinear function of the [Xc]/[Xc,crit] ratio (magenta curve). The cell is assumed to have a constant Regeneration capacity (dashed black line). When Chemical load exceeds Regeneration capacity (t0 < t < t1), the cell undergoes damage. Cellular damage is represented by the Damage variable (red curve), which has nonpositive values proportional to the light red shaded area. When Chemical load is below Regeneration capacity and Fitness is below of its maximal value (t1 < t < t2), the cell undergoes regeneration. Regeneration is represented by the Regeneration variable (green curve), which has nonnegative values proportional to the green shaded area. When Chemical load is below Regeneration capacity but Fitness is maximal (t2 < t), nor damage, neither regeneration occurs. Fitness (blue curve) is calculated by adding the (scaled) nonnegative values of Regeneration and the (scaled) nonpositive values of Damage to the maximal value of Fitness. See text for details.
Fig 6
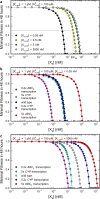
Fig 6. In silico cytotoxicity curves reveal impact of drug’s toxicity profile and protein level on survival.
Time course simulations were run for up to 48 hours from steady states belonging to different parameter sets and extracellular drug concentrations ([Xe], set at t0 = 0 h) as described in Methods. The minimal Fitness values reached in simulations were plotted against [Xe] (colored circles; connected by interpolation curves—see S1 Text). Critical concentrations of X’c and X”c are constant on all panels with values 1 μM and 100 μM, respectively. Critical concentration of Xc ([Xc,crit]) is indicated on the panels. a Impact of the toxicity of the unmetabolized form of the drug ([Xc,crit]) on in silico cytotoxicity. In silico cytotoxicity curves were plotted for [Xc,crit] values from 0.05 nM to 5 μM. The EC50 value is indicated for [Xc,crit] = 0.5 nM. b Impact of transporter and oxidase levels on in silico cytotoxicity when Xc is more toxic than X’c ([Xc,crit] = 0.05 nM). c Impact of transporter and oxidase levels on in silico cytotoxicity when Xc is less toxic than X’c ([Xc,crit] = 5 μM). In panels b and c in silico cytotoxicity curves were calculated after setting the transcription rates of ABC0 or CYP 0.2 or 5 times of its original value (S3 Table) to model lower or higher expression levels.

Similar articles

Cited by

References

    1. Chen Y, Tang Y, Guo C, Wang J, Boral D, et al. (2012) Nuclear receptors in the multidrug resistance through the regulation of drug-metabolizing enzymes and drug transporters. Biochemical pharmacology 83: 1112–1126. 10.1016/j.bcp.2012.01.030 - DOI - PMC - PubMed
    1. Corsini A, Bortolini M (2013) Drug-induced liver injury: the role of drug metabolism and transport. Journal of clinical pharmacology 53: 463–474. 10.1002/jcph.23 - DOI - PubMed
    1. Elsherbiny ME, Brocks DR (2011) The ability of polycyclic aromatic hydrocarbons to alter physiological factors underlying drug disposition. Drug metabolism reviews 43: 457–475. 10.3109/03602532.2011.596204 - DOI - PubMed
    1. Sarkadi B, Homolya L, Szakacs G, Varadi A (2006) Human multidrug resistance ABCB and ABCG transporters: participation in a chemoimmunity defense system. Physiological reviews 86: 1179–1236. - PubMed
    1. Shen DW, Pouliot LM, Hall MD, Gottesman MM (2012) Cisplatin resistance: a cellular self-defense mechanism resulting from multiple epigenetic and genetic changes. Pharmacological reviews 64: 706–721. 10.1124/pr.111.005637 - DOI - PMC - PubMed

Publication types

Substances

Grants and funding

This work was supported by Momentum (“Lendület”) Program of the Hungarian Academy of Sciences (http://mta.hu/articles/momentum-program-of-the-hungarian-academy-of-sciences-130009; GS), the Hungarian Scientific Research Fund (http://www.otka.hu/en; OTKA 83533 to BS; OTKA 111678 to TH), and the Hungarian Research and Technology Innovation Fund (“Kutatási és Technológiai Innovációs Alap“; KTIA-AIK-12-2012-0025; http://ktia.kormany.hu/; TH). TH is a Bolyai Fellow of the Hungarian Academy of Sciences. The funders had no role in study design, data collection and analysis, decision to publish, or preparation of the manuscript.

LinkOut - more resources