. 2015 Feb 19;518(7539):317-30.
doi: 10.1038/nature14248.

Integrative analysis of 111 reference human epigenomes

Roadmap Epigenomics ConsortiumAnshul Kundaje  1 Wouter Meuleman  2 Jason Ernst  3 Misha Bilenky  4 Angela Yen  2 Alireza Heravi-Moussavi  4 Pouya Kheradpour  2 Zhizhuo Zhang  2 Jianrong Wang  2 Michael J Ziller  5 Viren Amin  6 John W Whitaker  7 Matthew D Schultz  8 Lucas D Ward  2 Abhishek Sarkar  2 Gerald Quon  2 Richard S Sandstrom  9 Matthew L Eaton  2 Yi-Chieh Wu  2 Andreas R Pfenning  2 Xinchen Wang  10 Melina Claussnitzer  2 Yaping Liu  2 Cristian Coarfa  6 R Alan Harris  6 Noam Shoresh  11 Charles B Epstein  11 Elizabeta Gjoneska  12 Danny Leung  13 Wei Xie  13 R David Hawkins  13 Ryan Lister  8 Chibo Hong  14 Philippe Gascard  15 Andrew J Mungall  4 Richard Moore  4 Eric Chuah  4 Angela Tam  4 Theresa K Canfield  9 R Scott Hansen  16 Rajinder Kaul  16 Peter J Sabo  9 Mukul S Bansal  17 Annaick Carles  18 Jesse R Dixon  13 Kai-How Farh  11 Soheil Feizi  2 Rosa Karlic  19 Ah-Ram Kim  2 Ashwinikumar Kulkarni  20 Daofeng Li  21 Rebecca Lowdon  21 GiNell Elliott  21 Tim R Mercer  22 Shane J Neph  9 Vitor Onuchic  6 Paz Polak  23 Nisha Rajagopal  13 Pradipta Ray  20 Richard C Sallari  2 Kyle T Siebenthall  9 Nicholas A Sinnott-Armstrong  2 Michael Stevens  24 Robert E Thurman  9 Jie Wu  25 Bo Zhang  21 Xin Zhou  21 Arthur E Beaudet  26 Laurie A Boyer  27 Philip L De Jager  28 Peggy J Farnham  29 Susan J Fisher  30 David Haussler  31 Steven J M Jones  32 Wei Li  33 Marco A Marra  34 Michael T McManus  35 Shamil Sunyaev  28 James A Thomson  36 Thea D Tlsty  15 Li-Huei Tsai  12 Wei Wang  7 Robert A Waterland  37 Michael Q Zhang  38 Lisa H Chadwick  39 Bradley E Bernstein  40 Joseph F Costello  14 Joseph R Ecker  8 Martin Hirst  41 Alexander Meissner  5 Aleksandar Milosavljevic  6 Bing Ren  13 John A Stamatoyannopoulos  9 Ting Wang  21 Manolis Kellis  2
Collaborators, Affiliations

Integrative analysis of 111 reference human epigenomes

Roadmap Epigenomics Consortium et al. Nature. .

Abstract

The reference human genome sequence set the stage for studies of genetic variation and its association with human disease, but epigenomic studies lack a similar reference. To address this need, the NIH Roadmap Epigenomics Consortium generated the largest collection so far of human epigenomes for primary cells and tissues. Here we describe the integrative analysis of 111 reference human epigenomes generated as part of the programme, profiled for histone modification patterns, DNA accessibility, DNA methylation and RNA expression. We establish global maps of regulatory elements, define regulatory modules of coordinated activity, and their likely activators and repressors. We show that disease- and trait-associated genetic variants are enriched in tissue-specific epigenomic marks, revealing biologically relevant cell types for diverse human traits, and providing a resource for interpreting the molecular basis of human disease. Our results demonstrate the central role of epigenomic information for understanding gene regulation, cellular differentiation and human disease.


Figures
Extended Data 1
Extended Data 1
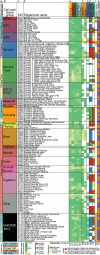
a-d. Tissues and Cell Types of Reference Epigenomes. Comprehensive listing of all 111 reference epigenomes generated by the consortium, along with epigenome identifiers (EIDs), including: (a) adult samples; (b) fetal samples; (c) ESC, iPSC, and ESC-derived cells; and (d) primary cultures. Colors indicate the groupings of tissues and cell types (as in Fig. 2b, and throughout the manuscript). For five samples (adult osteoblasts, and fetal liver, spleen, gonad, and spinal cord), no color is present, indicating that these are not part of the 111 reference epigenomes (ENCODE 2012 samples, or not all five marks in the core set were present), but datasets from these samples are high quality and were sometimes used in companion paper analyses, and are available to the public. e. Assay correlations. Heatmap of the pairwise experiment correlations for the core set of five histone modification marks (H3K4me1, H3K4me3, H3K36me3, H3K27me3, H3K9me3) across all 127 reference epigenomes, the two common acetylation marks (H3K27ac and H3K9ac), and DNA accessibility (DNase) across the reference epigenomes where they are available. Yellow indicates relatively higher correlation and blue lower correlation. Rows and columns were ordered computationally to maximize similarity of neighboring rows and columns (see Methods). All experiments for H3K9me3, H3K27me3, H3K36me3, DNase, and H3K4me1 are consistently ordered into distinct and contiguous groups. For H3K4me3, H3K9ac, and H3K27ac, experiments group primarily based on the mark, but in some cases, the correlations and ordering appear more cell type driven.
Extended Data 2
Extended Data 2. Chromatin state model robustness and enrichments
a. Chromatin state model robustness. Clustering of 15-state ‘core’ chromatin state model learned jointly across reference epigenomes (Fig. 4a) with chromatin state models learned independently in 111 reference epigenomes. We applied ChromHMM to learn a 15-state ChromHMM model using the five core marks in each of the 111 reference epigenomes generated by the Roadmap Epigenomics program, and clustered the resulting 1680 state emission probability vectors (leaves of the tree) with the 15 states from the joint model (indicated by arrows). We found that the vast majority of states learned across cell types clustered into 15 clusters, corresponding to the joint model states, validating the robustness of chromatin states across cell types. This analysis revealed two new clusters (red crosses) which are not represented in the 15 states of the jointly-learned model: ‘HetWk’, a cluster showing weak enrichment for H3K9me3; and ‘Rpts’, a cluster showing H3K9me3 along with a diversity of other marks, and enriched in specific types of repetitive elements (satellite repeats) in each cell type, which may be due to mapping artifacts. This joint clustering also revealed subtle variations in the relative intensity of H3K4me1 in states TxFlnk, Enh, and TssBiv, and H3K27me3 in state TssBiv. Overall, this analysis confirms that the 15-state chromatin state model based on the core set of five marks provides a robust framework for interpreting epigenomic complexity across tissues and cell types. b. Enrichments for 15-state model based on five histone modification marks. Top Left: TF binding site overlap enrichments of 15 states in H1-ESC from the ‘core’ model for transcription factor binding sites (TFBS) based on ChIP-seq data in H1-ESC. TF binding coverage for other cell-types based on matched TF ChIP-seq data is shown in Fig. S2. Top Right: Enrichments for expressed and non-expressed genes in H1-ESC and GM12878. Bottom: Positional enrichments at the transcription start site (TSS) and transcription end site (TES) of expressed (expr.) and repressed (repr.) genes in H1-ESC. Transition probabilities show frequency of co-occurrence of each pair of chromatin states in neighboring 200-bp bins. d. Definition and enrichments for 18-state ‘expanded’ model that also includes H3K27ac associated with active enhancer and active promoter regions, but which was only available for 98 of the 127 reference epigenomes. Inclusion of H3K27ac distinguishes active enhancers and active promoters. Top: TFBS enrichments in H1-ESC (E003) chromatin states using ENCODE TF ChIP-seq data in H1-ESC . Bottom: Positional enrichments in H1-ESC for genomic annotations, expressed and repressed genes, TSS and TES, and state transitions as in Extended Data 2b and Fig. 4a-c. Right: Average fold-enrichment (colors bars) and standard deviation (black line) across 98 reference epigenomes (Fig. S3d) for the fold enrichment for non-coding of genomic segments (GERP) in each chromatin state (rows) in the 18-state model. Even after excluding protein-coding exons (see Fig. S3b vs. Fig. S3d), the TSS-proximal states show the highest levels of conservation, followed by EnhBiv and the three non-transcribed enhancer states. In contrast, Tx and TxWk elements are weakly depleted for conserved regions, and Znf/Rpts, and Het are strongly depleted for conserved elements.
Extended Data 3
Extended Data 3. Relationship between histone marks, DNA methylation, DNA accessibility, and gene expression
a. H3K27ac-marked ‘active’ enhancers show higher levels of DNA accessibility, based on enrichment of DNase-seq signal confidence scores (-log10(Poisson p-value))for elements in each chromatin state in our extended 18-state model that includes the core five histone modification marks and H3K27ac, similar to Fig. 4e. b. Level of whole-genome bisulfite methylation for all chromatin states in the 18-state model shows that H3K27ac-marked ‘active’ enhancers associated with H3K27ac in addition to H3K4me1 show lower methylation levels, consistent with higher regulatory activity. The whiskers in a. and b. show 1.5 x IQR (interquartile range) and the filled circles are individual outliers c. DNA methylation levels for genes showing different expression levels. The depletion of DNA methylation in promoter regions, and the enrichment of DNA methylation in transcribed regions, are both more pronounced for highly expressed genes. The enrichment for high DNA methylation is more pronounced in the 3’ ends of the most highly expressed genes. d. Genes associated with active enhancer states have consistently significantly higher expression. ‘Active enhancer’ associated genes have at least one EnhA1 and/or EnhA2 +/−20Kb from TSS (18-state model). ‘Weak-enhancer’genes are associated with EnhG1, EnhG2, EnhWk, EnhBiv. Lowest expression have genes that are not associated with any enhancer. Plots with red markers show median expression of genes associated with ‘active’ enhancers, yellow markers ‘weak’ enhancers, and white markers no association with any enhancer state. e. Higher-expression genes show greater association with H3K27ac-marked ‘active’ enhancers. Highly expressed genes are consistently more frequently associated with H3K27ac-marked active enhancers (EnhA1 and EnhA2) across all cell types. Fraction of genes associated with H3K27ac-marked ‘active’ enhancers (red), H3K27ac-lacking ‘weak’ enhancers only (yellow), or no enhancers (white) for genes of varying expression levels in each cell type with RNA-seq data.
Extended Data 4
Extended Data 4. Methylation relationship with chromatin state
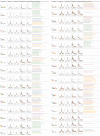
a-c. DNA methylation levels in 15-state model across technologies. We observed significant differences in the average methylation levels observed that were correlated with the different DNA methylation platforms used, but their relative relationships in average chromatin state methylation were conserved. Relative to WGBS (panel a, repeated from Fig. 4d for comparison purposes), RRBS (panel b) showed the lowest overall methylation levels (as expected given its CpG island enrichment), while mCRF showed the highest (panel c). This highlights the importance of recognizing and potentially correcting for DNA methylation platform specific biases prior performing integrative analyse. d,e. Distribution of DNA methylation levels measured using RRBS and mCRF in 18-state model (defined in Extended Data 2c). WGBS is shown in Extended Data 3b. The whiskers in a., b., c., d., and e. show 1.5 x IQR (interquartile range) and the filled circles are individual outliers f. DNA methylation variation across cell types. Density plots denote distribution of DNA methylation levels from 0% to 100% for each chromatin state across the 95 reference epigenomes profiled for whole-genome bisulfite (WGBS, red), reduced representation bisulfite (RRBS, blue), or MeDIP/MRE (mCRF, green). The respective color (red, blue, or green) was set to the maximum ln(density+1) value for each chromatin state and respective platform, with intermediate values colored on a natural log scale. For each panel, epigenomes are listed in the same order, shown on the right, with abbreviations of samples in the order of Fig. 2 for each technology.
Extended Data 5
Extended Data 5. Chromatin state variability, switching, and genomic coverage
a. Variability level for 18-state model. Chromatin state variability (similar to Fig. 5a), quantified based on the fraction of the genomic coverage (y-axis) of each state (color) that is consistently labeled with that state in at most N (ranging from 1 to 98) reference epigenomes, using the 18-state model learned based on 6 chromatin marks, including H3K27ac. b. Chromatin state over- and under-representation for 18-state expanded model. c. Log-ratio (log10) of chromatin state switching probabilities for the 18-state expanded model across 34 high-quality, non-redundant epigenomes that have H3K27ac data, relative to intra-tissue switching probabilities across replicates or samples from multiple individuals. d. Chromatin state coverage grouped by epigenomic domains. Top: Chromosome ‘painting’ of 11 clusters shown in Fig. 5d and discovered based on chromatin state co-occurrence at the 2Mb scale across reference epigenomes. Bottom: Enrichment of CpG islands in each cluster clearly showing higher CpG density ‘active’ clusters 3 and 6 comparing to passive clusters 9-11. Each box plot shows a distribution of CpG total occupancy in 2Mb bins in each cluster (with box boundaries indicate 25th and 75th percentiles the whiskers extend to the most extreme datapoints the algorithm considers to not be outliers. Points are drawn as outliers if they are larger than Q3+W*(Q3-Q1) or smaller than Q1-W*(Q3-Q1), where Q1 and Q3 are the 25th and 75th percentiles, respectively.).
Extended Data 6
Extended Data 6. Hierarchical clustering of epigenomes using diverse marks
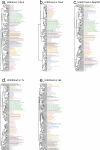
a-e. Clustering of all 127 reference epigenomes, including ENCODE samples, using H3K4me1, H3K4me3, H3K27me3, H3K36me3 and H3K9me3 signal in Enh, TssA, ReprPC, Tx and Het chromatin states, respectively. All panels show hierarchical clustering with optimal leaf ordering. Colors indicate sample groups, as defined in Fig. 2. Numbers on internal nodes represent bootstrap support scores over 1,000 bootstrap samples.
Extended Data 7
Extended Data 7
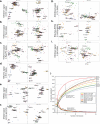
a-i. Multidimensional scaling (MDS) plots showing tissue/cell type similarity using different epigenomic marks. Multi-Dimensional Scaling (MDS) analysis results, showing reference epigenomes using their group coloring defined in Fig. 2. Thin lines connect same-group reference epigenomes. The first 4 axes of variation are shown in pairs. Marks are assessed in regions with relevant chromatin states (see Methods). j. Variance explained by each MDS dimension. The first 5 dimensions shown in Fig. S10 (Fig. 6b,c) explain between 45% and 80% of the total epigenometo-epigenome variance for all histone modification mark correlations, and additional dimensions explain less than 10%. Only a few components of H3K4me3 in TssA chromatin states explains a much larger fraction of the variance than other marks, possibly due to its stability across cell types.
Extended Data 8
Extended Data 8
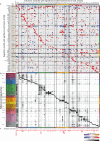
a. Regulatory motifs enriched in clusters. Enrichment (red) or depletion (blue) of regulatory motifs (rows) in the enhancer modules (columns) relative to shuffled control motifs. For each motif is shown the motif name, consensus logo, and correlation between regulator expression and module activity: positive correlation (orange) is indicative of activators, and negative correlation (purple) indicates a repressive role for the factor. Only clusters with enrichment or depletion of at least 2^1.5-fold for one motif are shown. b. Average activity level of enhancers of each module in each reference epigenome (black=high, white=low). Bottom: Total size of each enhancer module showing enrichment (in kb).
Extended Data 9
Extended Data 9
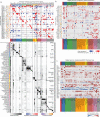
a. Regulatory motif enrichment, DGF enrichment, and positional bias for predicted driver motifs, based on strong (positive or negative) correlations between TF expression and enhancer module activity. a. Regulatory motif enrichments for the 40 regulators showing the strongest absolute correlation between TF expression and module activity. Of these, 36 were also recovered solely based on their motif enrichment scores (Extended Data 8), but six were only discovered based on their correlations (Esrra_4, Max_4, Mga_3, Nfatc1_3, Rest_2, and Tead3_1), illustrating the importance of studying motif enrichments in the context of TF expression and enhancer activity patterns. b. Predicted driver regulatory motifs are enriched in high-resolution DNase footprints. Enrichment of predicted driver motif instances (Fig. 8 and Extended Data 9a) in 42 high-resolution (6bp-40bp) Digital Genomic Footprinting (DGF) libraries from deeply sequenced DNase datasets shows consistent tissue preferences in matching cell types. For example, POU5F1 in iPS cells, HNF1B and HNF4A1 in digestive tissues, RFX4 in mesendoderm and neural lineages, MFE2B in muscle. c. Matrix of significant positional bias across factors and cell types. For each Digital Genomics Footprinting (DGF) dataset (columns), positional bias score (heatmap) of predicted driver regulatory motifs (rows) found to be significantly enriched (Fig. 8, Extended Data 9a) in enhancer modules (Fig. 7a).
Extended Data 10
Extended Data 10. Positional biases of predicted driver motifs relative to high-resolution DNase footprint centers and boundaries
a. Driver TF motif instance logo, as in Fig. 8 and Extended Data 9a. b. Distribution of motif instances relative to the center of the high-resolution DNase sites (digital genome footprints, DGF, lengths range from 6bp to 40bp), each curve colored according to the cell/tissue type (from Fig. 2, Table S5b). c. Distribution of shuffled motifs that match composition and number of conserved occurrences in the genome,. d. Positional bias relative to boundary of DGF region for true motifs, similar to b. e. Positional bias relative to boundary of DGF region for shuffled motifs, similar to c. f. Cell types showing significant positional bias after multiple testing correction, colored according to Fig. 2 and Table S5b.
Extended Data 11
Extended Data 11. Epigenomic enrichments of genetic variants associated with diverse traits
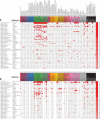
Tissue-specific enrichments for peaks of diverse epigenomic marks for genetic variants associated with complex disease, expanding Fig. 9. Enrichments are shown for: a. H3K4me1 peaks (enhancers). This panel includes all the data shown in Fig. 9, but expands the enrichments shown to all reference epigenomes (columns), and additional traits (rows) that did not meet the FDR=0.02 threshold. b. H3K27ac peaks (active enhancers). a-b. Studies were defined by a set of SNPs annotated in the GWAS catalog with the same combination of a trait (far left column) and publication shown by the Pubmed ID (far right column), uncorrected p-value (in -log10), and estimated FDR.
Extended Data 12
Extended Data 12. Epigenomic enrichments of genetic variants associated with diverse traits
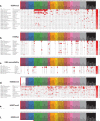
Tissue-specific enrichments for peaks of diverse epigenomic marks for genetic variants associated with complex disease, expanding Fig. 9. Enrichments are shown for: a. H3K4me3 peaks (promoters). b. H3K9ac peaks (active promoters and active enhancers). c. DNase peaks (accessible regions). d. H3K36me3 peaks (transcribed regions). e. H3K27me3 peaks (Polycomb-repressed regions). f. H3K9me3 peaks (heterochromatin regions). a-f. Studies were defined by a set of SNPs annotated in the GWAS catalog with the same combination of a trait (far left column) and publication shown by the Pubmed ID (far right column), uncorrected p-value (in -log10), and estimated FDR.
Figure 1
Figure 1. Tissues and cell types profiled in the Roadmap Epigenomics Consortium
Primary tissues and cell types representative of all major lineages in the human body were profiled, including multiple brain, heart, muscle, GI-tract, adipose, skin, and reproductive samples, as well as immune lineages, ESCs and induced Pluripotent Stem (iPS) cells, and differentiated lineages derived from ESCs. Box colors match groups shown in Fig. 2b. Epigenome identifiers (EIDs, Fig. 2c) for each sample shown in Extended Data 1.
Figure 2
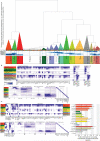
Figure 2. Datasets available for each reference epigenome
List of 127 epigenomes including 111 by the Roadmap Epigenomics program (E001-E113) and 16 by ENCODE (E114-E129). Full list of names and quality scores in Table S1. a-d: Tissue and cell types grouped by type of biological material (a), anatomical location (b), showing reference epigenome identifier (EID, c), and abbreviated name (d). PB=Peripheral Blood. ENCODE 2012 reference epigenomes shown separately. e-g. Normalized strand cross-correlation quality scores (NSC) for the core set of five histone marks (e), additional acetylation marks (f) and DNase-seq (g). h. Methylation data by WGBS (red), RRBS (blue), and mCRF (green). 104 methylation datasets available in 95 distinct reference epigenomes. i. Gene expression data using RNA-seq (Brown) and microarray expression (Yellow). j. 26 epigenomes contain a total of 184 additional histone modification marks. k. 60 highest-quality epigenomes (purple) were used for training the core chromatin state model, which was then applied to the full set of epigenomes (purple and orange).
Figure 3
Figure 3. Epigenomic information across tissues and marks
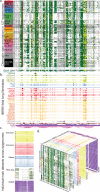
a. Chromatin state annotations across 127 reference epigenomes (rows, Fig. 2) in a ~3.5Mb region on chromosome 9. Promoters are primarily constitutive (red vertical lines), while enhancers are highly dynamic (dispersed yellow regions). b. Signal tracks for IMR90 showing RNA-seq, a total of 28 histone modification marks, whole-genome bisulfite DNA methylation, DNA accessibility, Digital Genomic Footprints (DGF), input DNA, and chromatin conformation information. c. Individual epigenomic marks across all epigenomes in which they are available. d. Relationship of figure panels highlights dataset dimensions.
Figure 4
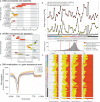
Figure 4. Chromatin states and DNA methylation dynamics
a. Chromatin state definitions, abbreviations, and histone mark probabilities. b. Average genome coverage. Genomic annotation enrichments in H1-ESC. c. Active and inactive gene enrichments in H1-ESC (see Extended Data 2b for GM12878). d. DNA methylation. e. DNA accessibility. d-e. Whiskers show 1.5 * interquartile range. Circles are individual outliers. f. Average overlap fold enrichment for GERP evolutionarily conserved non-coding regions. Bars denote standard deviation. g. DNA methylation (WGBS) density (color, ln scale) across cell types. red=max ln(density+1). Left column indicates tissue groupings, full list shown in Extended Data 4f. h. DNA methylation levels (left) and TF enrichment (right) during ESC differentiation. i. Chromatin mark changes during cardiac muscle differentiation. Heatmap=average normalized mark signal in Enh. C5 cluster enrichment.
Figure 5
Figure 5. Cell type differences in chromatin states
a. Chromatin state variability, based on genome coverage fraction consistently labeled with each state. b. Relative chromatin state frequency for each reference epigenome. c. Chromatin state switching log10 relative frequency (inter-cell-type vs. inter-replicate). d. Clustering of 2Mb intervals (columns) based on relative chromatin state frequency (fold enrichment), averaged across reference epigenomes. LaminB1 occupancy profiled in ESCs. Red lines show cluster average.
Figure 6
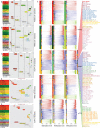
Figure 6. Epigenome relationships
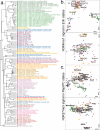
a. Hierarchical epigenome clustering using H3K4me1 signal in Enh states. Numbers indicate bootstrap support scores over 1,000 samplings. b-c. Multidimensional scaling (MDS) plot of cell type relationships based on similarity in H3K4me1 signal in Enh states (b) and H3K27me3 signal in ReprPC states (c). First four dimensions shown as dim1 vs. dim2 and dim3 vs. dim4.
Figure 7
Figure 7. Regulatory modules from epigenome dynamics
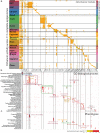
a. Enhancer modules by activity-based clustering of 2.3 million DNase-accessible regions classified as Enh, EnhG or EnhBiv (color) across 111 reference epigenomes. Vertical lines separate 226 modules. Broadly-active enhancers shown first. Module IDs shown in Fig. S11c. b-c. Proximal gene enrichments (b) for each module using gene ontology (GO) biological process (panel b) and human phenotypes (panel c). Rectangles pinpoint enrichments for selected modules. Representative gene set names (left) selected using bag-of-words enrichment.
Figure 8
Figure 8. Linking regulators to their target enhancers
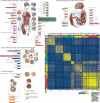
Module-level regulatory motif enrichment (Fig. S11) and correlation between regulator expression and module activity patterns (Extended Data 8a) are used to link regulators (boxes) to their likely target tissue and cell types (circles). Edge weight represents motif enrichment in the reference epigenomes of highest module activity.
Figure 9
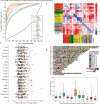
Figure 9. Epigenomic enrichments of genetic variants associated with diverse traits
Tissue-specific H3K4me1 peak enrichment for genetic variants associated with diverse traits. Circles denote reference epigenome (column) of highest enrichment for SNPs reported by a given study (row), defined by trait and publication (PubMed identifier, PMID). Tissue (Abbrev) and p-value (-log10) of highest enrichment are shown. Only rows and columns containing a value meeting a FDR of 2% are shown (Full matrix for all studies showing at least 2% FDR in Extended Data 11-12).

Similar articles

Cited by

References

    1. Rivera CM, Ren B. Mapping human epigenomes. Cell. 2013;155:39–55. - PMC - PubMed
    1. Zhou VW, Goren A, Bernstein BE. Charting histone modifications and the functional organization of mammalian genomes. Nat Rev Genet. 2011;12:7–18. - PubMed
    1. Jones PA. Functions of DNA methylation: islands, start sites, gene bodies and beyond. Nat Rev Genet. 2012;13:484–492. - PubMed
    1. Smith ZD, Meissner A. DNA methylation: roles in mammalian development. Nat Rev Genet. 2013;14:204–220. - PubMed
    1. Wang Z, Gerstein M, Snyder M. RNA-Seq: a revolutionary tool for transcriptomics. Nat Rev Genet. 2009;10:57–63. - PMC - PubMed

Publication types

MeSH terms

Grants and funding