. 2015 Feb 13;11(2):e1004956.
doi: 10.1371/journal.pgen.1004956. eCollection 2015 Feb.

HYPER RECOMBINATION1 of the THO/TREX complex plays a role in controlling transcription of the REVERSION-TO-ETHYLENE SENSITIVITY1 gene in Arabidopsis

Affiliations

HYPER RECOMBINATION1 of the THO/TREX complex plays a role in controlling transcription of the REVERSION-TO-ETHYLENE SENSITIVITY1 gene in Arabidopsis

Congyao Xu et al. PLoS Genet. .

Abstract

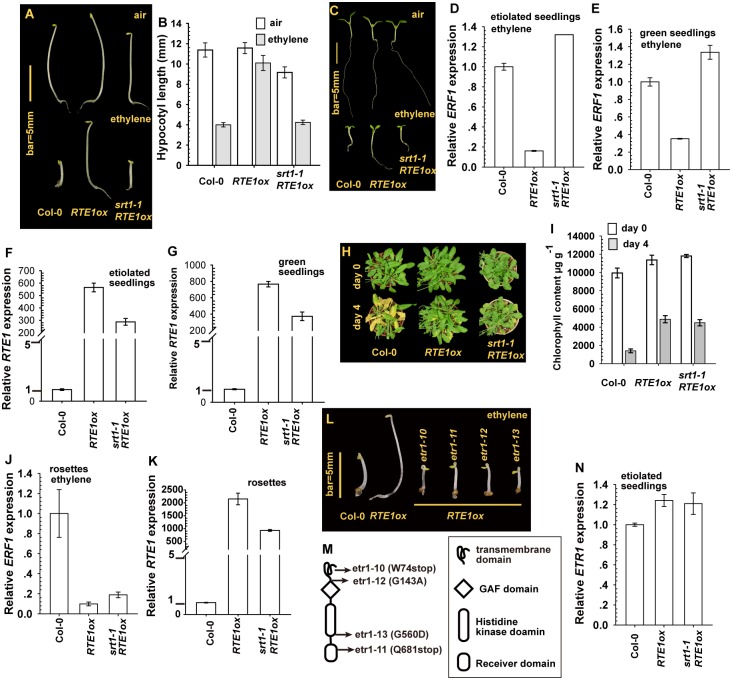
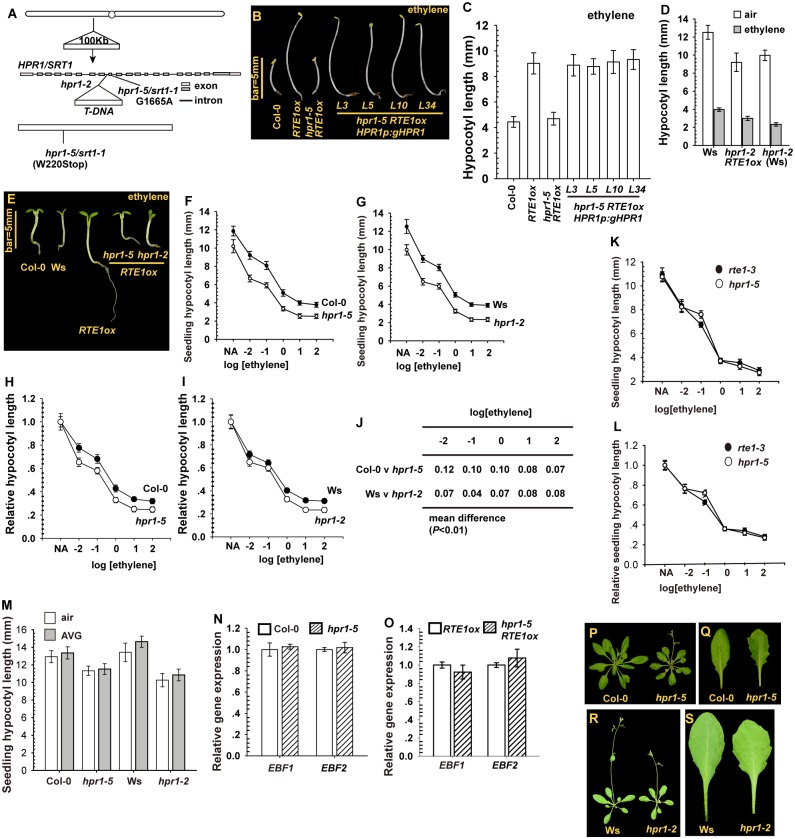
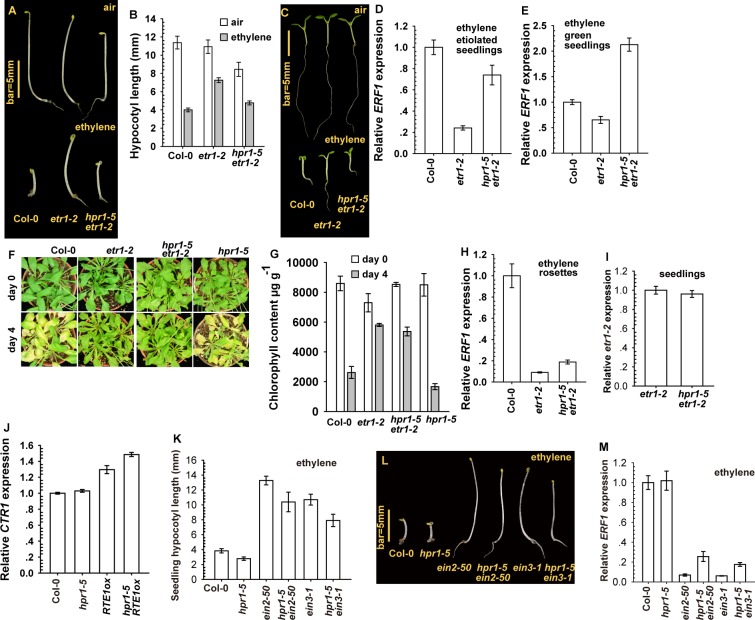
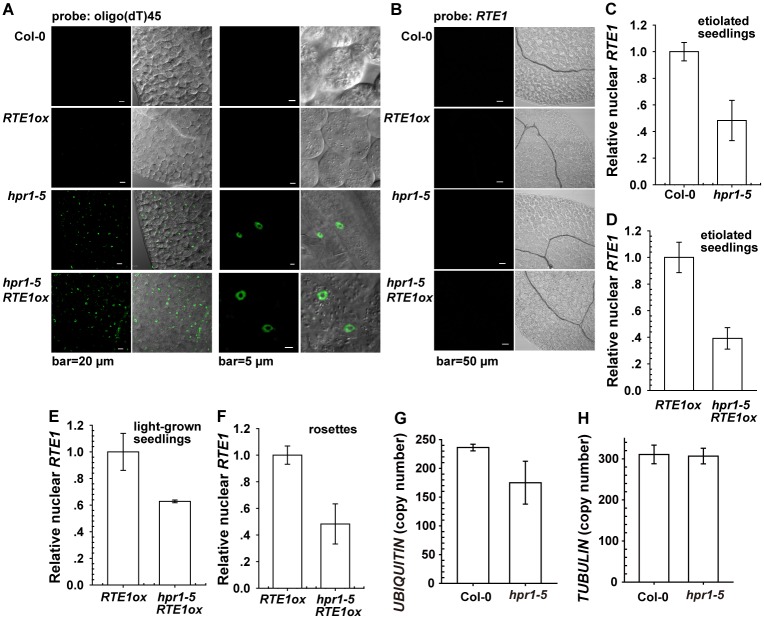
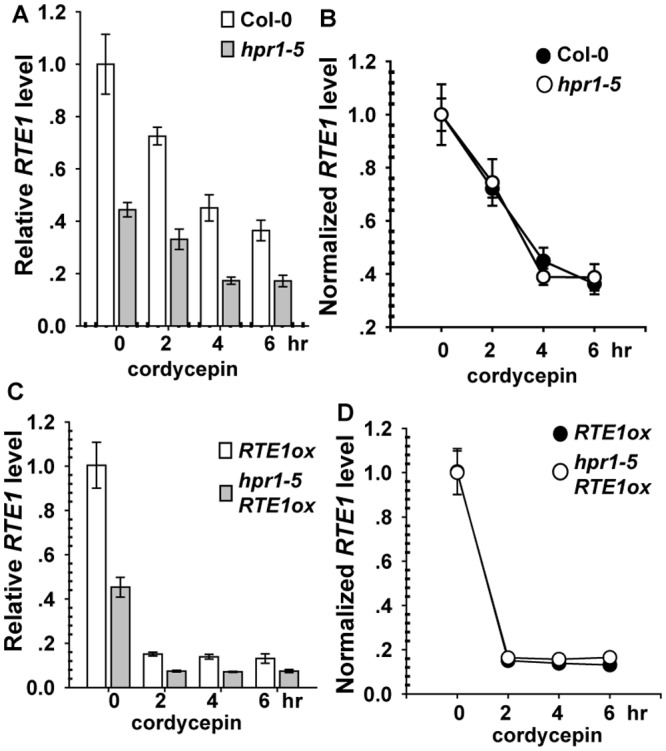
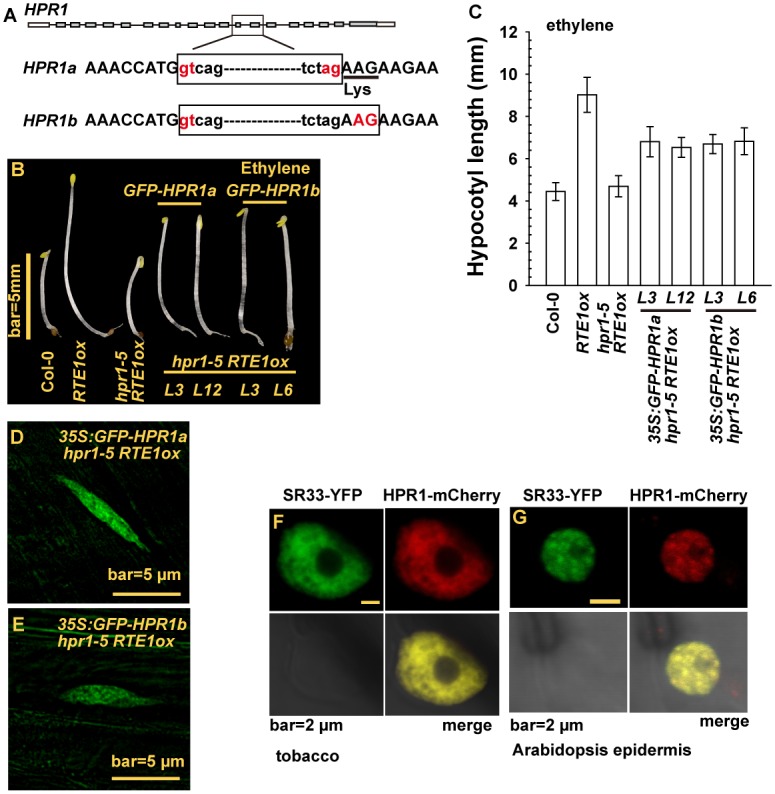
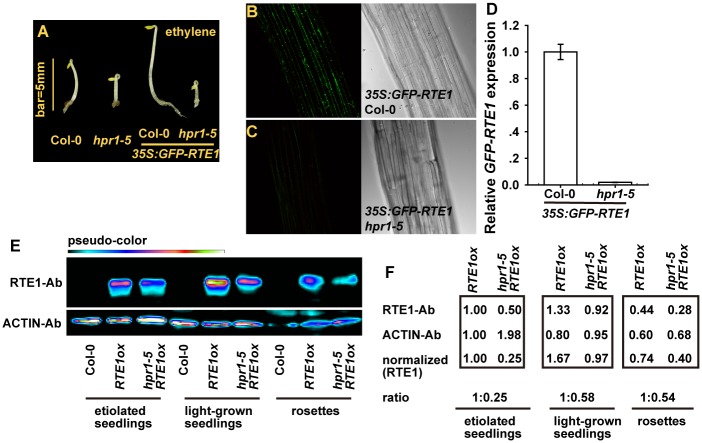
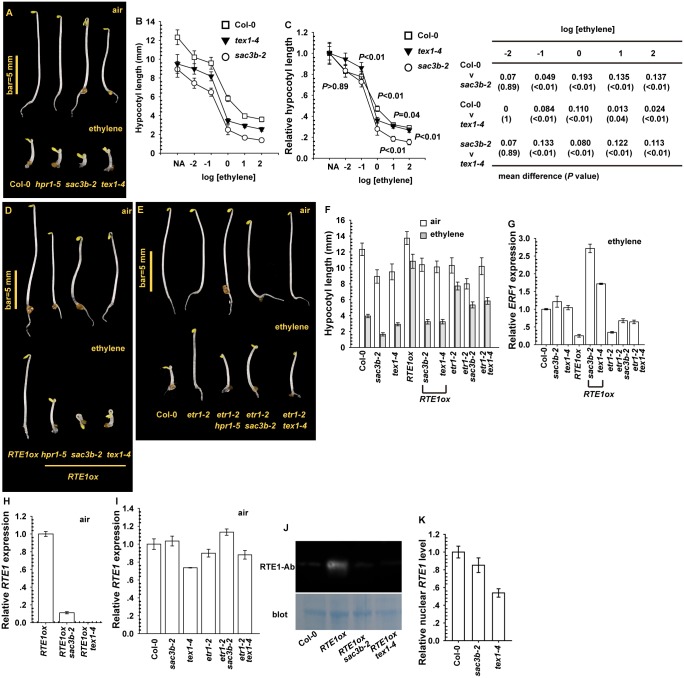
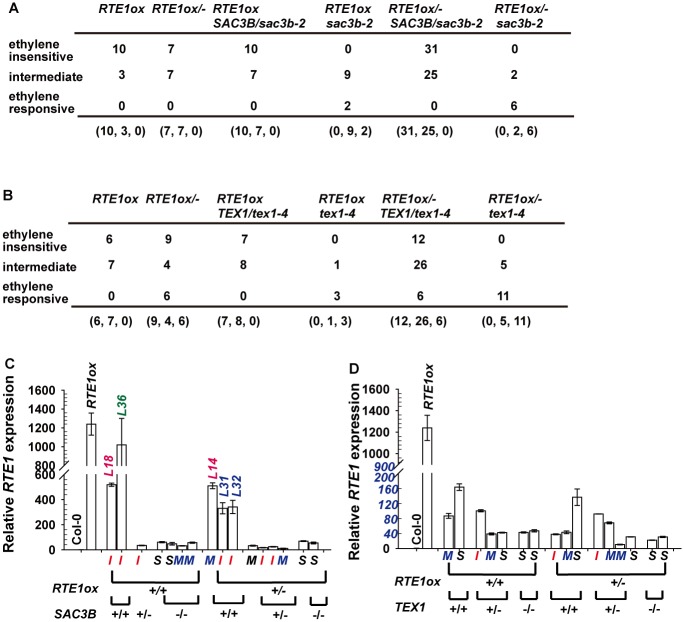
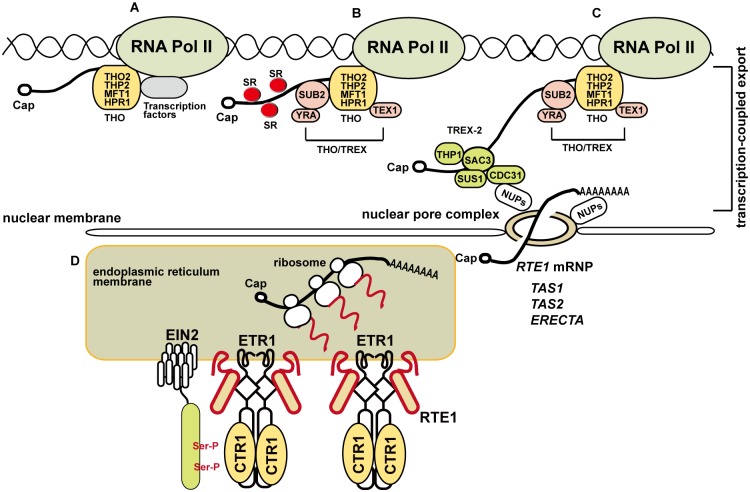
Arabidopsis REVERSION-TO-ETHYLENE SENSITIVITY1 (RTE1) represses ethylene hormone responses by promoting ethylene receptor ETHYLENE RESPONSE1 (ETR1) signaling, which negatively regulates ethylene responses. To investigate the regulation of RTE1, we performed a genetic screening for mutations that suppress ethylene insensitivity conferred by RTE1 overexpression in Arabidopsis. We isolated HYPER RECOMBINATION1 (HPR1), which is required for RTE1 overexpressor (RTE1ox) ethylene insensitivity at the seedling but not adult stage. HPR1 is a component of the THO complex, which, with other proteins, forms the TRanscription EXport (TREX) complex. In yeast, Drosophila, and humans, the THO/TREX complex is involved in transcription elongation and nucleocytoplasmic RNA export, but its role in plants is to be fully determined. We investigated how HPR1 is involved in RTE1ox ethylene insensitivity in Arabidopsis. The hpr1-5 mutation may affect nucleocytoplasmic mRNA export, as revealed by in vivo hybridization of fluorescein-labeled oligo(dT)45 with unidentified mRNA in the nucleus. The hpr1-5 mutation reduced the total and nuclear RTE1 transcript levels to a similar extent, and RTE1 transcript reduction rate was not affected by hpr1-5 with cordycepin treatment, which prematurely terminates transcription. The defect in the THO-interacting TEX1 protein of TREX but not the mRNA export factor SAC3B also reduced the total and nuclear RTE1 levels. SERINE-ARGININE-RICH (SR) proteins are involved mRNA splicing, and we found that SR protein SR33 co-localized with HPR1 in nuclear speckles, which agreed with the association of human TREX with the splicing machinery. We reveal a role for HPR1 in RTE1 expression during transcription elongation and less likely during export. Gene expression involved in ethylene signaling suppression was not reduced by the hpr1-5 mutation, which indicates selectivity of HPR1 for RTE1 expression affecting the consequent ethylene response. Thus, components of the THO/TREX complex appear to have specific roles in the transcription or export of selected genes.


Conflict of interest statement

The authors have declared that no competing interests exist.

Figures

Figure 1
Figure 1. Effect of SUPPRESSOR OF RTE1 OVEREXPRESSION1 (SRT1) on the ethylene insensitivity in REVERSION-TO-ETHYLENE SENSITIVITY1 overexpressor (RTE1ox).
Etiolated seedling phenotype (A), hypocotyl measurement (B), and light-grown seedling phenotype (C) for RTE1ox and srt1–1 RTE1ox seedlings. Expression of ETHYLENE RESPONSE FACTOR1 (ERF1) in RTE1ox with the srt1–1 allele in etiolated (D) and light-grown (E) seedlings on ethylene treatment. RTE1 expression in RTE1ox and srt1–1 RTE1ox seedlings grown in dark (F) and light (G). Leaf senescence phenotype (H) and chlorophyll content (I) in RTE1ox and srt1–1 RTE1ox plants. ERF1 (J) and RTE1 (K) expression in rosette leaves. Phenotype (L) of etiolated RTE1ox seedlings with the indicated etr1 mutations (M). (N) ETR1 expression is not altered by srt1–1. Data are mean±SD for seedling hypocotyls (n>30) and chlorophyll content (n>3), and mean± SE for gene expression (at least 3 independent biological samples with 3 measurement for each). Ethylene concentration is 10 μL L-1 for the seedling growth inhibition test and ERF1 induction, and 100 μL L-1 for the leaf senescence test.
Figure 2
Figure 2. The cloning and isolation of HPR1/SRT1 and the mutants.
(A) Map-based cloning of HPR1/SRT1, and isolation of the hpr1–5/srt1–1 and hpr1–2 alleles. Etiolated seedling phenotype (B) and hypocotyl measurement (C) for hpr1–5 RTE1ox expressing the HPR1p:gHPR1 transgene. Etiolated seedling hypocotyl measurement (D) and light-grown seedling phenotype (E) for hpr1–2 RTE1ox. Ethylene concentration is 10 μL L-1. Ethylene dose–response assay by etiolated seedling hypocotyl measurement of hpr1–5 (F) and hpr1–2 (G) and by normalized hypocotyl measurement for hpr1–5 (H) and hpr1–2 (I). (J) Mean difference in normalized hypocotyl length between wild-type and hpr1–5 and hpr1–2 seedlings. Ethylene dose-response curves of the absolute (K) and normalized (L) lengths of hypocotyls of etiolated rte1–3 and hpr1–5 seedlings. (M) Hypocotyl length of etiolated seedlings with AVG treatment. Relative gene expression of EIN3-BINDING F-BOX PROTEIN1 (EBF1) and EBF2 in the wild type (Col-0) and hpr1–5 (N) and RTE1ox and hpr1–5 RTE1ox (O). Rosette (P) and leaf (Q) phenotype of the wild type (Col-0) and hpr1–5 plants. Rosette (R) and leaf (S) phenotype of the wild type (Ws) and hpr1–2 plants. Data are mean±SD for seedling hypocotyls (n>30) and mean±SE for gene expression measurement (n = 3 with 3 technical repeats). Student’s t test is for paired comparison for means of 2 measurements. Ethylene concentration presented in logarithm of ethylene (μL L-1) for the dose-response assay.
Figure 3
Figure 3. The hpr1–5 allele suppressed etr1–2 ethylene insensitivity at the seedling stage.
Etiolated seedling phenotype (A), hypocotyl measurement (B), and light-grown seedling phenotype (C) for etr1–2 and hpr1–5 etr1–2. ERF1 expression in etiolated (D) and light-grown (E) seedlings of etr1–2 and hpr1–5 etr1–2. Leaf senescence phenotype (F) and chlorophyll content (G) in etr1–2 and hpr1–5 etr1–2 plants. (H) ERF1 expression in etr1–2 and hpr1–5 etr1–2 rosettes. Expression of etr1–2 (I) and CTR1 (J) is not reduced by the hpr1–5 mutation. Measurement (K) and phenotype (L) of hypocotyls of etiolated seedlings of ein2–50 and ein3–1 mutants with and without the hpr1–5 allele, and ERF1 expression in these genotypes (M). Data are mean±SD seedling hypocotyls (n>30) and chlorophyll content (n>3), and mean±SE for gene expression (at least 3 independent biological samples with 3 measurements for each). Ethylene concentrations are 10 μL L-1 for ERF1 induction and 100 μL L-1 for the leaf senescence test.
Figure 4
Figure 4. Effect of the hpr1–5 allele on bulk and RTE1 mRNA accumulation in the nucleus.
Nuclear fluorescence by fluorescine-labeled oligo(dT)45 (A) and RTE1 (B) probes. Nuclear RTE1 level in etiolated seedlings of the wild-type (Col-0) and hpr1–5 (C); etiolated (D) and light-grown (E) RTE1ox and hpr1–5 RTE1ox seedlings; and RTE1ox and hpr1–5 RTE1ox rosette leaves (F). Measurement of the nuclear UBIQUITIN (G) and TUBULIN (H) transcript copy number in the wild type (Col-0) and hpr1–5. Data are mean±SE, with 3 measurements for each 3 independent biological samples.
Figure 5
Figure 5. RTE1 degradation with cordycepin treatment.
Measured (A) and normalized (B) RTE1 level with cordycepin treatment in wild-type (Col-0) and hpr1–5 seedlings. Measured (C) and normalized (D) RTE1 level with cordycepin treatment in RTE1ox and hpr1–5 RTE1ox seedlings. Data are mean±SE, with 3 measurements for each 3 independent biological samples.
Figure 6
Figure 6. HPR1 produces 2 transcripts and HPR1 subcellular localization.
(A) HPR1 produces 2 transcripts by alternative splicing. Phenotype (B) and hypocotyl measurement (C) of etiolated hpr1–5 RTE1ox seedlings expressing GREEN FLUORESCENT PROTEIN (GFP)-fused HPR1a and HPR1b. The fluorescence of GFP-HPR1a (D), GFP-HPR1b (E) in hpr1–5 RTE1ox seedlings. Speckle domain co-localization of the fluorescence by SR33-YFP and HPR1-mCherry in tobacco (F) and Arabidopsis epidermis (G).
Figure 7
Figure 7. RTE1 level is reduced in the hpr1–5 mutant.
(A) Phenotype of etiolated seedlings of the hpr1–5 mutant with and without 35S:GFP-RTE1. Fluorescence of GFP-RTE1 in wild-type (Col-0) (B) and hpr1–5 (C) seedlings expressing the 35S:GFP-RTE1 transgene and (D) GFP-RTE1 expression measurement. Data are mean±SE, with 3 measurements for each 3 independent biological samples. Immunofluorescence (E) and quantification (F) of RTE1 level in RTE1ox and hpr1–5 RTE1ox at seedling and rosette stages. ACTIN was an internal reference for RTE1 normalization. Pseudo-color indicates immunofluorescence of weak (dark) to strong (bright) signal. RTE1 antibodies (RTE1-Ab) and ACTIN-Ab are monoclonal Abs.
Figure 8
Figure 8. Effect of sac3b-2 and tex1–4 alleles on RTE1 expression.
(A) Phenotype of etiolated sac3b-2 and tex1–4 seedlings and wild-type (Col-0) and hpr1–5 seedlings. Ethylene dose–response assay of hypocotyl length (B) and normalized hypocotyl length (C) for wild-type (Col-0), sac3b-2, and tex1–4 seedlings. Mean difference and statistical significance were estimated by Scheffe test (α = 0.01). Ethylene concentration is presented as the logarithm of ethylene (in μL L-1). Phenotype of etiolated seedlings for the indicated genotypes (sac3b-2 and text1–4) in RTE1ox (D) and the etr1–2 allele (E), and hypocotyl length (F) and ERF1 level (G) for the corresponding seedlings. RTE1 level in RTE1ox seedlings with the sac3b-2 and text1–4 alleles (H) and in sac3b-2 and tex1–4 seedlings with and without the etr1–2 allele (I). (J) Immunofluorescence of RTE1 level in RTE1ox and the indicated genotypes with the sac3b-2 and tex1–4 alleles. (K) Nuclear RTE1 level in sac3b-2 and tex1–4. Blot: Commassie Blue staining to indicate the protein amount on the membrane. RTE1-Ab: a monoclonal antibody for RTE1. Data are mean±SD for seedling hypocotyls (n>30), and mean±SE for gene expression (at least 3 independent biological samples with 3 measurements for each).
Figure 9
Figure 9. Analyses for the ethylene response phenotype and RTE1 expression in 35S:RTE1-containing individuals.
Genotypes and ethylene response phenotypes for 35S:RTE1-containing F2 seedlings from a genetic crossing of RTE1ox and sac3b-2 (A) and RTE1ox and tex1–4 (B). (C) and (D) Rosette RTE1 levels in 35S:RTE1-containing F2 individuals, with their genotypes and seedling ethylene-response phenotypes; I, M, and S indicate ethylene-insensitive, intermediate, and ethylene-responsive seedling phenotypes, respectively. L: line number for individual F2 lines. Data are mean±SD for 3 technical repeats, without biological duplicates.
Figure 10
Figure 10. A model for the involvement of the THO/TREX complex component HPR1 in RTE1 transcription and ethylene signaling regulation.
(A) THO is associated with RNA polymerase II, possibly with transcription factors, for transcription. (B) On transcription progression, different components are recruited for mRNA transcription and processing; the SUB2-YRA dimer is recruited to form the THO/TREX complex and TEX1 is a component associated with the complex. SERINE-ARGININE–RICH proteins (SRs) are involved in RNA splicing and co-localize with the THO/TREX complex at nuclear speckle domains. (C) RNA transcription is coupled to TREX-2 (consisting of SAC3, THP1, SUS1, and CDC31) for nucleocytoplamic export through the nuclear pore complex (NPC) via the tethering of TREX-2 with nucleoporins (NUPs). Normal expression of ERECTA [25] and RTE1 requires HPR1, and siRNAs derived from TAS1 and TAS2 involves HPR1 and TEX1 [15, 24]. RTE1 ribonucleoprotein particle (RNP) export could be mediated by other components. (D) Once exported for translation, the produced RTE1 protein facilitates ETR1 receptor signaling to CTR1; EIN2 is retained at the endoplasmic reticulum on phosphorylation by CTR1 and ethylene signaling is prevented. HPR1 could be required for efficient RTE1 transcription elongation through regions with higher-order RNA/DNA structures or a stable RNA–DNA hybrid that obstructs RNA polymerase II movement. Ser-P: phosphorylation of serine residues on EIN2.

Similar articles

Cited by

References

    1. Wang W, Hall AE, O’Malley R, Bleecker AB (2003) Canonical histidine kinase activity of the transmitter domain of the ETR1 ethylene receptor from Arabidopsis is not required for signal transmission. Proc Natl Acad Sci U S A 100: 352–357. 10.1073/pnas.0237085100 - DOI - PMC - PubMed
    1. Hua J, Meyerowitz EM (1998) Ethylene responses are negatively regulated by a receptor gene family in Arabidopsis thaliana . Cell 94: 261–271. 10.1016/S0092-8674(00)81425-7 - DOI - PubMed
    1. Wang W, Esch JJ, Shiu S-H, Agula H, Binder BM, et al. (2006) Identification of Important Regions for Ethylene Binding and Signaling in the Transmembrane Domain of the ETR1 Ethylene Receptor of Arabidopsis . Plant Cell 18: 3429–3442. 10.1105/tpc.106.044537 - DOI - PMC - PubMed
    1. Gao Z, Wen C-K, Binder BM, Chen Y-F, Chang J, et al. (2008) Heteromeric Interactions among Ethylene Receptors Mediate Signaling in Arabidopsis . J Biol Chem 283: 23801–23810. 10.1074/jbc.M800641200 - DOI - PMC - PubMed
    1. Chen Y-F, Gao Z, Kerris RJ III, Wang W, Binder BM, et al. (2010) Ethylene Receptors Function as Components of High-Molecular-Mass Protein Complexes in Arabidopsis . PLoS ONE 5: e8640 10.1371/journal.pone.0008640 - DOI - PMC - PubMed

Publication types

MeSH terms

Grants and funding

This work was supported by the the Chinese Ministry of Science and Technology (2011CB100700 and 2012AA10A302-2; http://program.most.gov.cn/)and National Natural Sciences Foundation of China (31123006 and 31370314; http://www.nsfc.org.cn/) to CKW. The funders had no role in study design, data collection and analysis, decision to publish, or preparation of the manuscript.