. 2015 Feb 13;10(2):e0116899.
doi: 10.1371/journal.pone.0116899. eCollection 2015.

Deletion of AU-rich elements within the Bcl2 3'UTR reduces protein expression and B cell survival in vivo

Affiliations

Deletion of AU-rich elements within the Bcl2 3'UTR reduces protein expression and B cell survival in vivo

Manuel D Díaz-Muñoz et al. PLoS One. .

Abstract

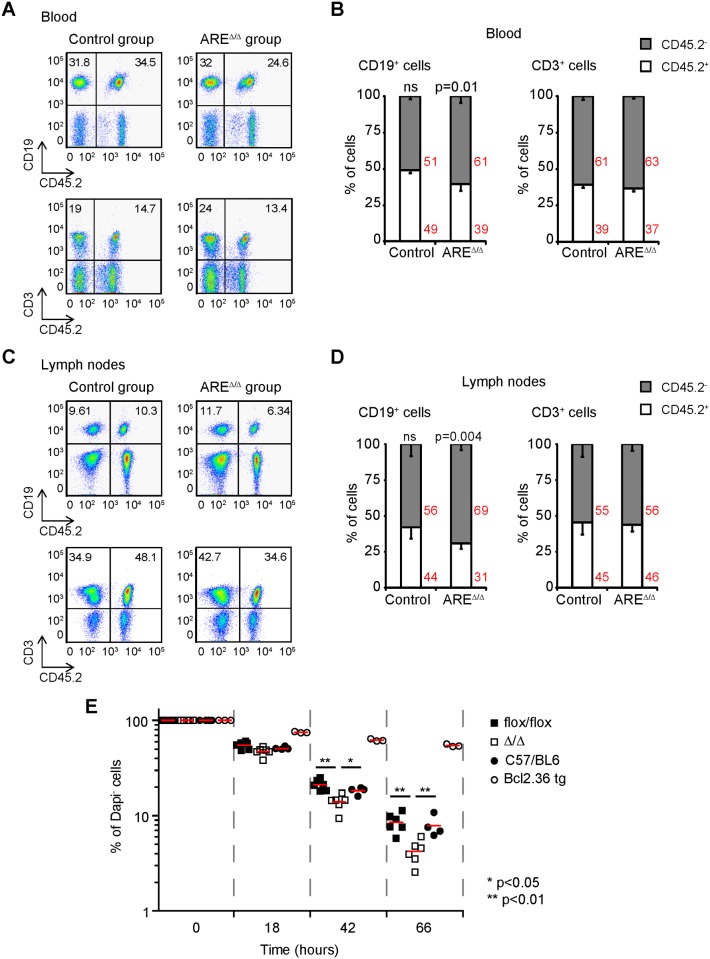
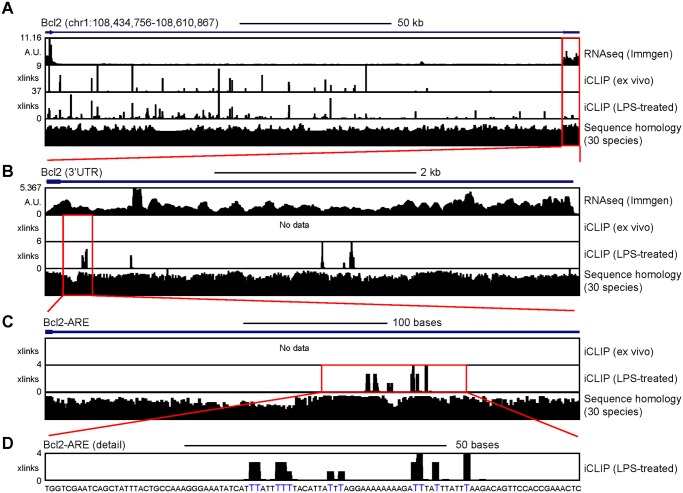
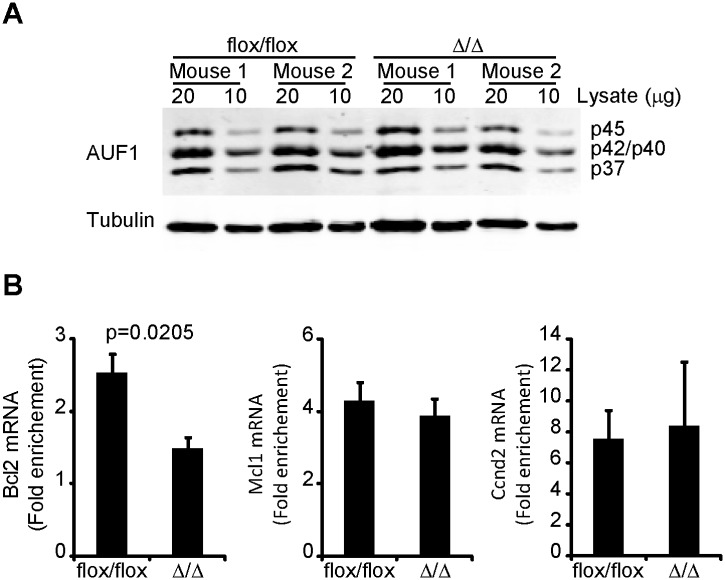
Post-transcriptional mRNA regulation by RNA binding proteins (RBPs) associated with AU-rich elements (AREs) present in the 3' untranslated region (3'UTR) of specific mRNAs modulates transcript stability and translation in eukaryotic cells. Here we have functionally characterised the importance of the AREs present within the Bcl2 3'UTR in order to maintain Bcl2 expression. Gene targeting deletion of 300 nucleotides of the Bcl2 3'UTR rich in AREs diminishes Bcl2 mRNA stability and protein levels in primary B cells, decreasing cell lifespan. Generation of chimeric mice indicates that Bcl2-ARE∆/∆ B cells have an intrinsic competitive disadvantage compared to wild type cells. Biochemical assays and predictions using a bioinformatics approach show that several RBPs bind to the Bcl2 AREs, including AUF1 and HuR proteins. Altogether, association of RBPs to Bcl2 AREs contributes to Bcl2 protein expression by stabilizing Bcl2 mRNA and promotes B cell maintenance.


Conflict of interest statement

Competing Interests: The authors have declared that no competing interests exist.

Figures

Fig 1
Fig 1. Description of the Bcl2 ARE-rich sequence removed in Bcl2-ARE∆/∆ B cells.
A, Phylogenetic analysis of the exon 2 of Bcl2 (Phylo-VISTA analysis). B, Alignment of the human and mouse Bcl2 ARE-rich sequence that is deleted from the wild type allele in Bcl2-ARE∆/∆ (∆/∆) B cells (Bcl2-AREflox/flox x mb1cre mice). C, Genomic analysis of Bcl2 alleles in B cells and non-B cells from Bcl2-AREflox/flox x mb1wt (flox/flox) and Bcl2-AREflox/flox x mb1cre (∆/∆) mice. CD19+ LN B cells were isolated by negative selection using magnetic beads. Positively labelled cells during the isolation procedure were processed as LN non-B cells. Genomic DNA was isolated and used for genotyping using two qPCR assays. Assay A assessed for DNA abundance, and assay B detected the loxP- flanked ARE. The ratio between assay B and assay A (Ratio B/A) is shown.
Fig 2
Fig 2. Bcl2 mRNA stability and protein expression are diminished in the absence of the Bcl2 ARE-rich sequence.
A, qPCR analysis of Bcl2 mRNA levels in LN B cells from C57BL/6 (wt/wt), Bcl2-AREflox/flox x mb1wt (flox/flox) and Bcl2-AREflox/flox x mb1cre (∆/∆) mice. B, Relative quantification of Bcl2 mRNA in splenic B cells before and after stimulation with LPS (10 μg/ml) for 24 hours. β-actin was used as reference gene. n = 3 mice per genotype. C, Analysis of Bcl2 mRNA stability in splenic B cells from Bcl2-AREflox/flox x mb1wt (flox/flox) and Bcl2-AREflox/flox x mb1cre (∆/∆) mice. Splenic B cells were treated with LPS (10 μg/ml) for 24 hours before adding ActD (5 μg/ml). Cells were collected after 0, 15, 30, 60, 120 and 240 minutes and total RNA was extracted using TriZol. mRNA levels of Bcl2 and β-actin were assessed by qPCR. Data are shown as mRNA abundance relative to time 0. Data from one of the two independent experiments performed are shown. In both experiments, cells from three mice per genotype were processed independently to assess biological variability. Data are shown as the mean value + SD. D, flow cytometry analysis of Bcl2 protein expression in FO B cells (CD19+ CD93- CD21+ CD23+ cells) and MZ B cells (CD19+ CD93- CD21+ CD23low) from spleens of C57BL/6, Bcl2-AREflox/flox x mb1wt (flox/flox) and Bcl2-AREflox/flox x mb1cre (∆/∆) mice. Protein quantification is shown as median fluorescence intensity (MFI) (n = 6 mice per genotype). A non-parametric t test was performed for statistical analysis of the data in Fig. 2B and 2D. P values are shown.
Fig 3
Fig 3. B cell development in the bone marrow is normal in Bcl2-AREflox/flox x mb1cre mice.
A, Flow Cytometry analysis of pro-B cells (B220+ IgM- IgD- c-kit+ CD25- cells), pre-B cells (B220+ IgM- IgD- c-kit- CD25+ cells), immature-B cells (B220+ CD43- IgM+ IgD- cells) and mature-B cells (B220high CD43- IgM+ IgD+ cells) from the bone marrow of Bcl2-AREflox/flox x mb1wt (flox/flox) and Bcl2-AREflox/flox x mb1cre (∆/∆) mice. N = 6–7 mice per genotype. The mean percentage of cells in each gate is shown within the plots. B, Quantification of total number of pro-, pre-, immature- and mature-B cells. A Mann-Whitney test was performed for statistical analysis of the data. P values are shown for each cell population.
Fig 4
Fig 4. Bcl2-AREflox/flox x mb1cre mice have a reduced numbers of FO B cells in the periphery.
A, Flow cytometry analysis of FO B cells (CD19+ CD93- CD23+ CD21+ cells), MZ B cells (CD19+ CD93- CD23low CD21high cells) and transitional B cells (T1: CD19+ CD93+ IgM+ CD23- cells; T2: CD19+ CD93+ IgM+ CD23+ cells; and T3: CD19+ CD93+ IgMlow CD23+ cells cells) in spleens from Bcl2-AREflox/flox x mb1wt (flox/flox) and Bcl2-AREflox/flox x mb1cre (∆/∆) mice. N = 6/7 mice per genotype. The mean percentage of cells in each gate is shown in each representative plot. B, Quantification of the number of total splenocytes, FO B cells, MZ B cells, and transitional B cells, defined as described above. C, Analysis of CD19+ B cells and CD4+ T cells in peripheral LN (inguinal, brachial and axillary LNs were pooled together for the analysis). The mean percentage of cells in each gate is shown in the plots. N = 5–7 mice per genotype. D, Quantitation of the number of CD19+ B cells and CD4+ T cells. A Mann-Whitney test was performed for statistical analysis of the data. P values are shown for each cell population.
Fig 5
Fig 5. Loss of the Bcl2 ARE-rich sequence confers a competitive disadvantage to B cells.
A, Flow cytometry analysis of competitive bone marrow chimeras. BM cells from B6.SJL and mb1cre mice (control group) or B6.SJL and Bcl2-AREflox/flox x mb1cre mice (ARE∆/∆ group) were mixed in a 1 to 1 ratio and injected into lethally irradiated B6.SJL mice. Blood samples were taken after eight weeks of BM reconstitution for flow cytometry using CD19, CD3 and CD45.2 as cell markers. B, Analysis of B and T cell proportions in BM chimera mice. A Mann-Whitney non parametric test was performed for statistical analysis of the data. P values are indicated. n = 8–9 mice per genotype. C, Analysis of B and T cells present in peripheral LNs of the mice described in A. Representative pseudo-colour dot plots are shown. D, Quantitation of B and T cell proportions in LNs. E, Survival analysis of LN B cells from C57BL/6, Eμ-bcl2–36, Bcl2-AREflox/flox x mb1wt (flox/flox) and Bcl2-AREflox/flox x mb1cre (∆/∆) mice. B cells were cultured in vitro in the absence of cytokines. Cell survival was tested at the indicated times by DAPI staining. A Mann-Whitney test was performed for statistical analysis of the data.
Fig 6
Fig 6. HuR only binds to the Bcl2 ARE-rich sequence after B cell activation.
A, Genomic annotation of HuR- crosslinks across the Bcl2 locus. Representative data from iCLIP experiments (n = 3) performed with total cells extracts from freshly isolated B cells or LPS-activated B cells are shown. The number on the left hand of each genomic track refers to the maximum number of unique counts identified at a single nucleotide level (called cross(x)-links). Bcl2 expression data from CD19+ CD3- splenic B cells (RNAseq from ImmGen.org) and sequence homology analysis across 30 species are shown in independent genomic tracks. B, Representation of HuR- crosslinks within the 3’UTR of Bcl2. C, Analysis of HuR binding to the Bcl2 ARE-rich sequence. D, Sequence analysis of HuR binding to the ARE. Single nucleotide interactions with HuR are coloured in blue.
Fig 7
Fig 7. AUF1 binding to Bcl2 mRNA is reduced in the absence of the Bcl2 ARE-rich sequence.
A, Analysis of AUF1 protein expression in splenic B cells from Bcl2-AREflox/flox x mb1wt (flox/flox) and Bcl2-AREflox/flox x mb1cre (∆/∆) mice. Two different amounts of total cell lysates (10 and 20 μg) were loaded in SDS-PAGE gels. AUF1 protein was detected by Western blot with tubulin used as loading control. B, AUF1 immunoprecipitation. Total cell extracts from splenic B cells from Bcl2-AREflox/flox x mb1wt (flox/flox) and Bcl2-AREflox/flox x mb1cre (∆/∆) mice were used for RIP experiments using a specific antibody against AUF1 or an isotype rabbit IgG antibody. Bcl2 mRNA was detected by qPCR. Mcl1 and Ccnd2 mRNAs were detected as control mRNAs of AUF1-RNA IP. Data are shown as mRNA fold enrichment (AUF1 IP / IgG IP). The data shown in this figure are from three independent experiments. In each experiment, splenic B cells from 2–3 mice per genotype were processed independently to assess biological variability. A Mann-Whitney test was performed for statistical analysis of the data.

Similar articles

Cited by

References

    1. Aukema SM, Siebert R, Schuuring E, van Imhoff GW, Kluin-Nelemans HC, et al. (2011) Double-hit B-cell lymphomas. Blood 117: 2319–2331. 10.1182/blood-2010-09-297879 - DOI - PubMed
    1. Leskov I, Pallasch CP, Drake A, Iliopoulou BP, Souza A, et al. (2013) Rapid generation of human B-cell lymphomas via combined expression of Myc and Bcl2 and their use as a preclinical model for biological therapies. Oncogene 32: 1066–1072. 10.1038/onc.2012.117 - DOI - PMC - PubMed
    1. Tsujimoto Y, Finger LR, Yunis J, Nowell PC, Croce CM (1984) Cloning of the chromosome breakpoint of neoplastic B cells with the t(14;18) chromosome translocation. Science 226: 1097–1099. - PubMed
    1. McDonnell TJ, Deane N, Platt FM, Nunez G, Jaeger U, et al. (1989) bcl-2-immunoglobulin transgenic mice demonstrate extended B cell survival and follicular lymphoproliferation. Cell 57: 79–88. - PubMed
    1. Letai A, Sorcinelli MD, Beard C, Korsmeyer SJ (2004) Antiapoptotic BCL-2 is required for maintenance of a model leukemia. Cancer Cell 6: 241–249. - PubMed

Publication types

MeSH terms

Substances

LinkOut - more resources