. 2015 Sep;26(9):2139-51.
doi: 10.1681/ASN.2014080770. Epub 2015 Feb 12.

Heme Oxygenase-1 Regulates Myeloid Cell Trafficking in AKI

Affiliations

Heme Oxygenase-1 Regulates Myeloid Cell Trafficking in AKI

Travis D Hull et al. J Am Soc Nephrol. 2015 Sep.

Abstract

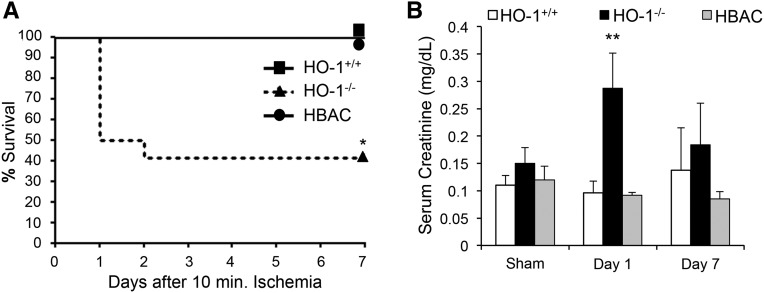
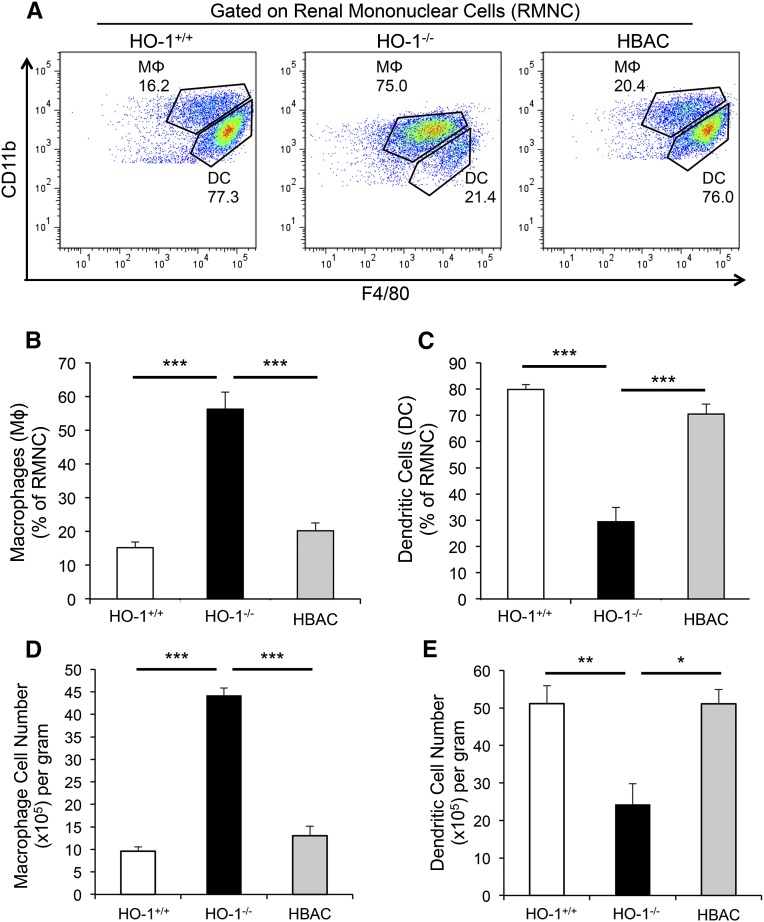
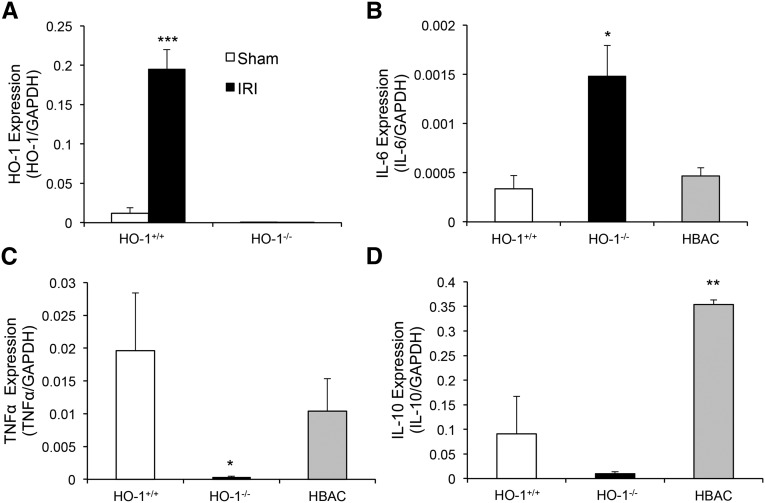
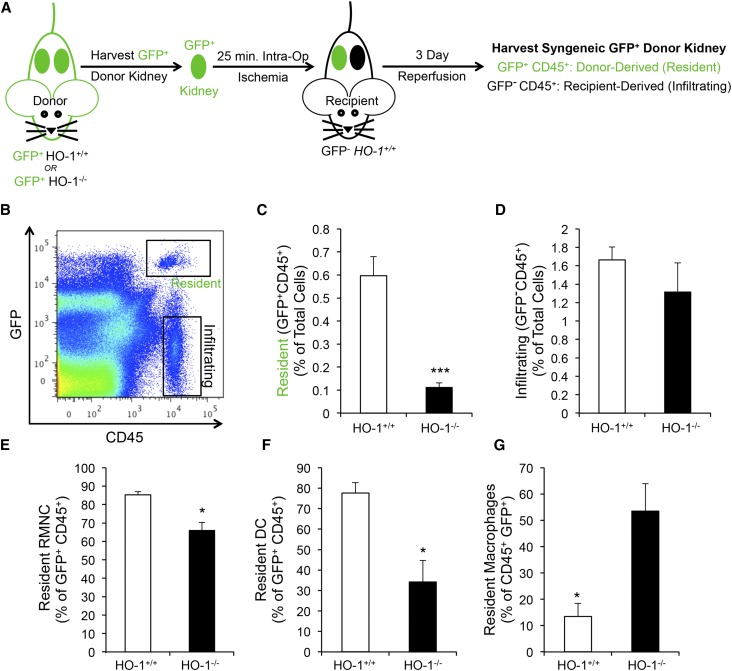
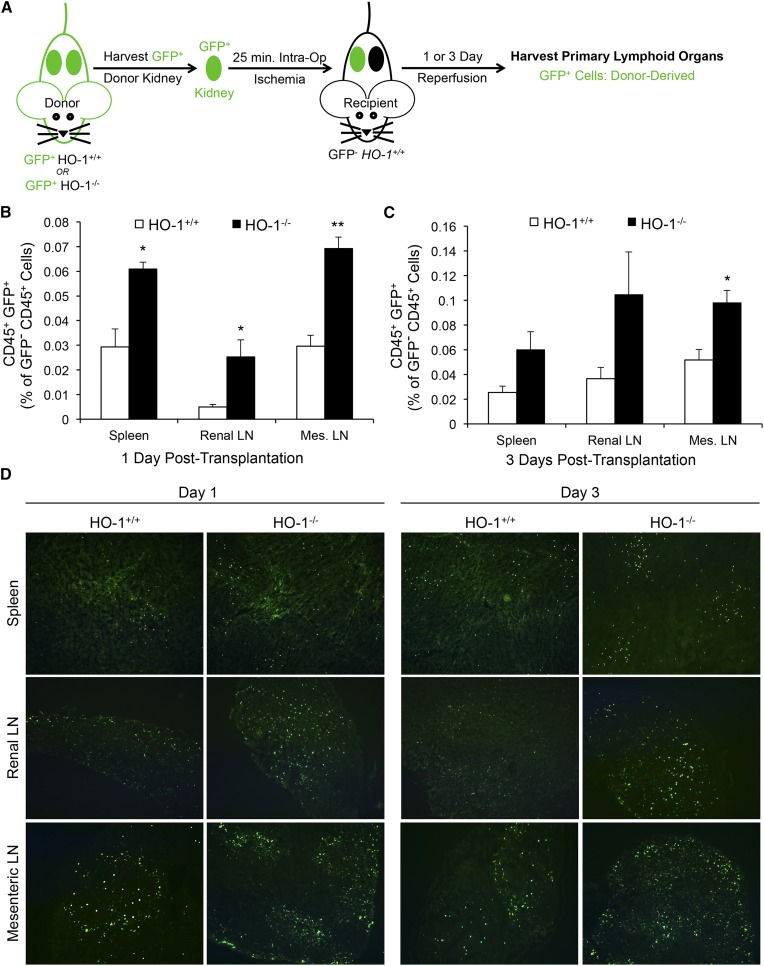
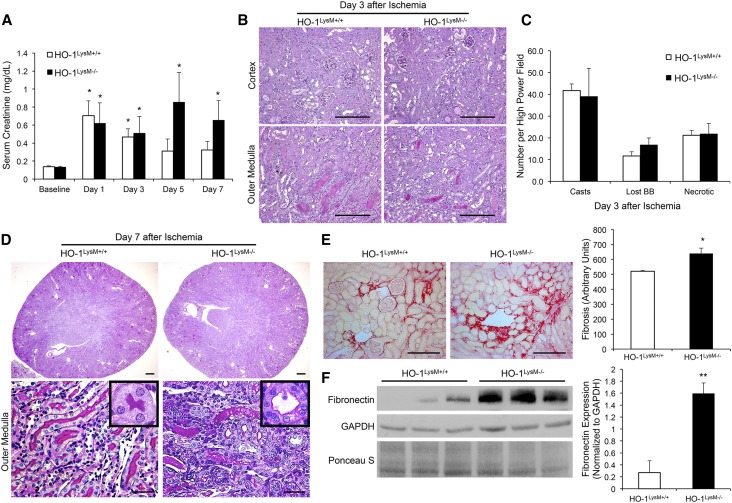
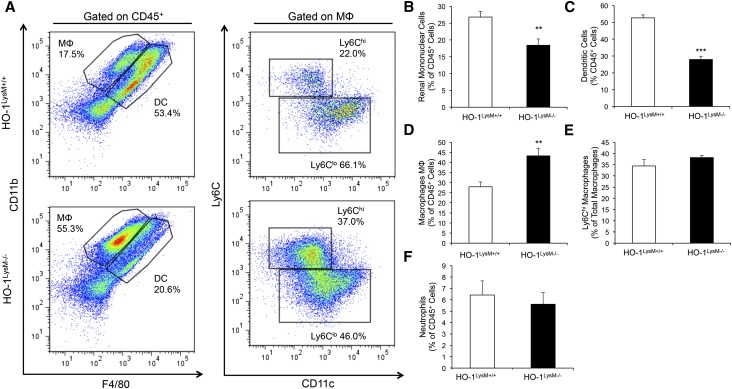
Renal ischemia-reperfusion injury is mediated by a complex cascade of events, including the immune response, that occur secondary to injury to renal epithelial cells. We tested the hypothesis that heme oxygenase-1 (HO-1) expression, which is protective in ischemia-reperfusion injury, regulates trafficking of myeloid-derived immune cells in the kidney. Age-matched male wild-type (HO-1(+/+)), HO-1-knockout (HO-1(-/-)), and humanized HO-1-overexpressing (HBAC) mice underwent bilateral renal ischemia for 10 minutes. Ischemia-reperfusion injury resulted in significantly worse renal structure and function and increased mortality in HO-1(-/-) mice. In addition, there were more macrophages (CD45(+) CD11b(hi)F4/80(lo)) and neutrophils (CD45(+) CD11b(hi) MHCII(-) Gr-1(hi)) in HO-1(-/-) kidneys than in sham and HO-1(+/+) control kidneys subjected to ischemia-reperfusion. However, ischemic injury resulted in a significant decrease in the intrarenal resident dendritic cell (DC; CD45(+)MHCII(+)CD11b(lo)F4/80(hi)) population in HO-1(-/-) kidneys compared with controls. Syngeneic transplant experiments utilizing green fluorescent protein-positive HO-1(+/+) or HO-1(-/-) donor kidneys and green fluorescent protein-negative HO-1(+/+) recipients confirmed increased migration of the resident DC population from HO-1(-/-) donor kidneys, compared to HO-1(+/+) donor kidneys, to the peripheral lymphoid organs. This effect on renal DC migration was corroborated in myeloid-specific HO-1(-/-) mice subjected to bilateral ischemia. These mice also displayed impaired renal recovery and increased fibrosis at day 7 after injury. These results highlight an important role for HO-1 in orchestrating the trafficking of myeloid cells in AKI, which may represent a key pathway for therapeutic intervention.

Keywords: ARF; heme oxygenase; macrophages.


Figures

Figure 1.
Figure 1.
HO-1−/− mice exhibit increased susceptibility to renal IRI. (A) Kaplan–Meier survival plot demonstrating mortality over 7 days in HO-1+/+ (n=10), HO-1−/− (n=12), and HBAC (n=6) mice subjected to 10 minutes of IRI. *P<0.05 versus HO-1+/+ and HBAC. (B) Serum creatinine levels in sham-operated mice and after 1 or 7 days of IRI. Results are presented as the mean±SEM. **P<0.01 in HO-1−/− versus HO-1+/+ and HBAC mice at day 1. n=6–12 for IRI groups and n=3–4 for sham groups.
Figure 2.
Figure 2.
HO-1 expression prevents tubulointerstitial damage and renal fibrosis after IRI. (A) Representative micrographs demonstrating tubulointerstitial damage in the outer medulla of kidneys from HO-1+/+, HO-1−/− or HBAC mice subjected to sham surgery or 1 or 7 days of reperfusion after 10 minutes of ischemia. Transverse sections are stained with periodic acid–Schiff. n=4 per group. (B) Picrosirius red staining of kidney sections from HO-1+/+, HO-1−/−, and HBAC kidneys 7 days after IRI. n=4 per group. (C and D) Western blot analysis and densitometric quantification of the fibrosis markers α-smooth muscle actin (α-SMA) (C) and fibronectin (D) at day 7 after IRI. GAPDH is used as a loading control and for normalization of densitometry values. n=3 per group. *P≤0.05. Scale bar, 200 μm in A; 100 μm in B.
Figure 3.
Figure 3.
HO-1 deficiency alters the trafficking of myeloid-derived immune cells after IRI. One day after sham surgery or 10 minutes of bilateral IRI, kidneys are explanted and homogenized for analysis by flow cytometry. (A) Scheme depicting the sequential gating used to identify neutrophils (CD45+ CD11bhi MHCII Gr-1hi) and RMNCs (CD45+ CD11b+ MHCII+) in the kidney of HO-1+/+, HO-1−/−, and HBAC mice. (B and C) Representative flow cytometry histograms depicting the proportion of bone marrow–derived cells (CD45+) (B) or neutrophils and RMNCs (C) in the kidney after IRI. (D) Quantification of CD45+ cells in the kidney, presented as a proportion of total cells. (E and F) Quantification of neutrophils (E) and RMNCs (F) in the kidney, presented as a proportion of CD45+ cells. *P≤0.05; **P≤0.01; ***P≤0.001 versus the indicated group. Results are expressed as the mean±SEM. n=4 per group.
Figure 4.
Figure 4.
The intrarenal resident F4/80hi CD11blo subpopulation of RMNCs specifically decreases after IRI. (A) RMNCs (intrarenal CD11b+ MHCII+) from HO-1+/+, HO-1−/−, and HBAC mice subjected to IRI are further characterized based on their expression of F4/80. (B–D) F4/80lo CD11bhi macrophages (MΦ) (B) and F4/80hi CD11blo DCs (C) are presented as a proportion of total RMNCs and as absolute cell number per gram of kidney weight for macrophages (D) and DCs (E). *P≤0.05; **P≤0.01; ***P≤0.001 versus the indicated group. Results are expressed as the mean±SEM. n=4 per group.
Figure 5.
Figure 5.
HO-1–deficient RMNCs exhibit dysregulated cytokine gene expression. Gene expression in electronically sorted RMNCs is analyzed by real-time PCR. (A) HO-1 expression is assessed in HO-1+/+ and HO-1−/− mice subjected to sham or 10 minutes of ischemia and 1 day of reperfusion. (B–D) Expression of the cytokines IL-6 (B), TNFα (C), and IL-10 (D) is quantified in HO-1+/+, HO-1−/−, and HBAC RMNC 1 day after 10 minutes of renal ischemia. Analysis is performed in triplicate and results are normalized to GAPDH and expressed as the mean±SEM. *P≤0.05; **P≤0.01; ***P≤0.001. n=3 per group.
Figure 6.
Figure 6.
The resident RMNC population declines in HO-1−/− kidneys after IRI induced by syngeneic transplantation. (A) HO-1−/− or HO-1+/+ kidneys are harvested from GFP+ donors and transplanted into GFP HO-1+/+ littermates. IRI is modeled by 25 minutes of intraoperative ischemia. (B) Grafts are harvested 3 days after transplantation and analyzed by flow cytometry for the emigration of GFP+ CD45+ donor-derived resident cells or infiltration of GFP CD45+ recipient-derived inflammatory cells. (C and D) Emigration of GFP+ CD45+ donor-derived cells (C) and infiltration of GFP CD45+ recipient-derived cells (D), expressed as a proportion of the total renal cell population. (E–G) Donor-derived intrarenal resident cells are further characterized as CD11b+ MHCII+ RMNCs (E), F4/80hi CD11blo DCs (F), or F4/80lo CD11bhi macrophages (G) and expressed as a proportion of GFP+ CD45+ cells. *P<0.05; ***P≤0.001. n=3 per group. Results are expressed as the mean±SEM.
Figure 7.
Figure 7.
HO-1−/− RMNCs exhibit increased trafficking to the peripheral lymphoid organs. (A) RMNC trafficking is tracked using flow cytometry after syngeneic transplantation of GFP+ HO-1−/− or GFP+ HO-1+/+ donor kidneys. (B and C) One day (B) or 3 days (C) after transplantation, the spleen, renal LNs, and mesenteric (Mes.) LNs are harvested from kidney transplant recipients and donor-derived RMNCs that had emigrated from the graft are identified as GFP+ CD45+. (D) Increased trafficking from HO-1−/− grafts is confirmed in frozen tissue sections from the spleen, renal LNs, and mesenteric LNs from transplant recipients, utilizing the GFP+ signal from donor-derived RMNCs. *P≤0.05; **P≤0.01. n=3 per group. Results are expressed as the mean±SEM.
Figure 8.
Figure 8.
Myeloid HO-1 deficiency impairs resolution of kidney injury caused by IRI. Myeloid-restricted HO-1–deficient mice (HO-1LysM−/−) and controls (HO-1LysM+/+) are subjected to 25 minutes of bilateral IRI. (A) Serum creatinine (in milligrams per decaliter) is measured before (baseline) and at days 1, 3, 5, and 7 after IRI. (B) Representative micrographs of PAS-stained sections in the renal cortex (top) and outer medulla (bottom) of HO-1LysM−/− mice and HO-1LysM+/+ controls 3 days after IRI. (C) Cast formation, loss of the brush border, and necrotic tubules are quantified in the proximal tubules of the outer medulla. Results are expressed as an average of the total number counted per high-power field at ×200 total magnification and are presented as the mean±SEM. Five images are analyzed per mouse. n=4 per group. (D) Representative micrographs of PAS-stained kidney cross-sections (top) and outer medulla (bottom) of HO-1LysM−/− mice and HO-1LysM+/+ controls 7 days after IRI. Inset shows a single tubule at high magnification. (E) Picrosirius red staining and quantitation of collagen in representative kidney sections from HO-1LysM−/− and controls (HO-1LysM+/+) 7 days after IRI. n=3–4 per group. (F) Western blot analysis and densitometry for fibronectin 7 days after IRI. GAPDH is used as a loading control and for normalization of densitometry values. Ponceau S staining of the membrane is also shown. n=3 per group. *P≤0.05; **P≤0.01. PAS, periodic acid–Schiff; BB, brush border. Bar, 200 μm in B and D; 100 μm in E.
Figure 9.
Figure 9.
Myeloid HO-1 deficiency recapitulates the RMNC trafficking phenotype of global HO-1–deficient mice. Representative flow cytometry histograms (A) depicting the gating scheme for the proportional quantification of RMNCs (CD11b+ MHCII+) (B), DCs (F4/80hi CD11blo) (C), macrophages (MΦ; F4/80lo CD11bhi) (D), Ly6Chi (inflammatory) macrophages (E), and neutrophils (Gr-1hi CD11bhi MHCII) (F) 3 days after 25 minutes of bilateral ischemia. Data are presented as the proportion of the parent subset (n=7–8 per group). **P≤0.01; ***P≤0.001. Results expressed as the mean±SEM.

Comment in

  • Myeloid Cell HO-ming in AKI.
    Kinsey GR. Kinsey GR. J Am Soc Nephrol. 2015 Sep;26(9):2067-9. doi: 10.1681/ASN.2015010072. Epub 2015 Feb 12. J Am Soc Nephrol. 2015. PMID: 25677391 Free PMC article. No abstract available.

Similar articles

Cited by

References

    1. Kaushal GP, Shah SV: Challenges and advances in the treatment of AKI. J Am Soc Nephrol 25: 877–883, 2014 - PMC - PubMed
    1. Chawla LS, Eggers PW, Star RA, Kimmel PL: Acute kidney injury and chronic kidney disease as interconnected syndromes. N Engl J Med 371: 58–66, 2014 - PMC - PubMed
    1. Guo JK, Cantley LG: Cellular maintenance and repair of the kidney. Annu Rev Physiol 72: 357–376, 2010 - PubMed
    1. Kapitsinou PP, Sano H, Michael M, Kobayashi H, Davidoff O, Bian A, Yao B, Zhang MZ, Harris RC, Duffy KJ, Erickson-Miller CL, Sutton TA, Haase VH: Endothelial HIF-2 mediates protection and recovery from ischemic kidney injury. J Clin Invest 124: 2396–2409, 2014 - PMC - PubMed
    1. Li L, Okusa MD: Macrophages, dendritic cells, and kidney ischemia-reperfusion injury. Semin Nephrol 30: 268–277, 2010 - PMC - PubMed

Publication types

MeSH terms

LinkOut - more resources