

Increased dopamine D2 receptor activity in the striatum alters the firing pattern of dopamine neurons in the ventral tegmental area
- PMID: 25675529
- PMCID: PMC4378386
- DOI: 10.1073/pnas.1500450112
Increased dopamine D2 receptor activity in the striatum alters the firing pattern of dopamine neurons in the ventral tegmental area
Abstract
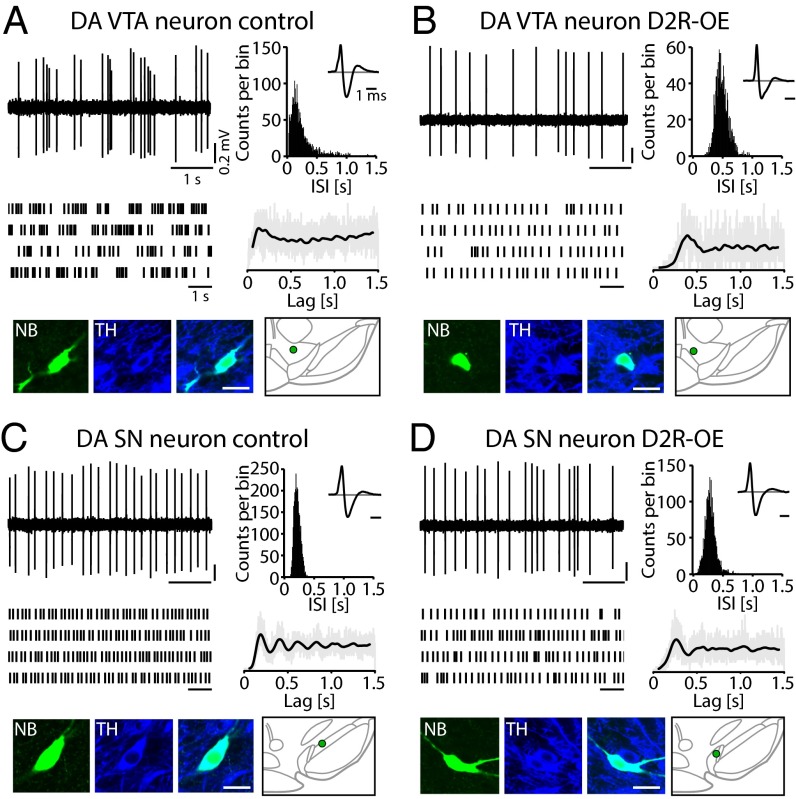
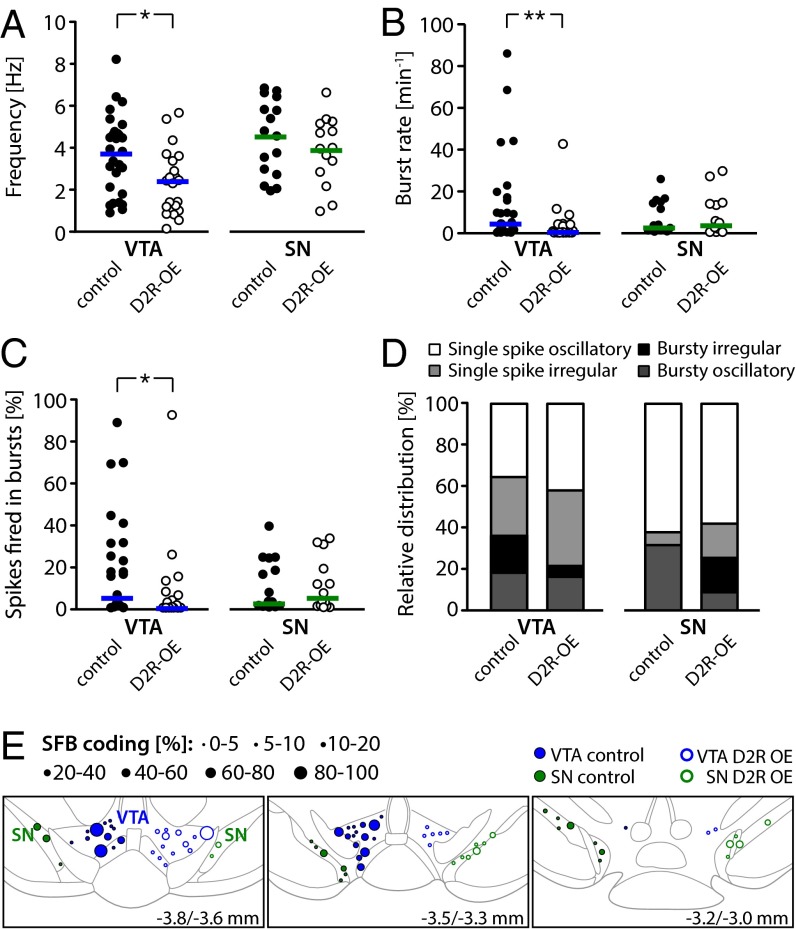
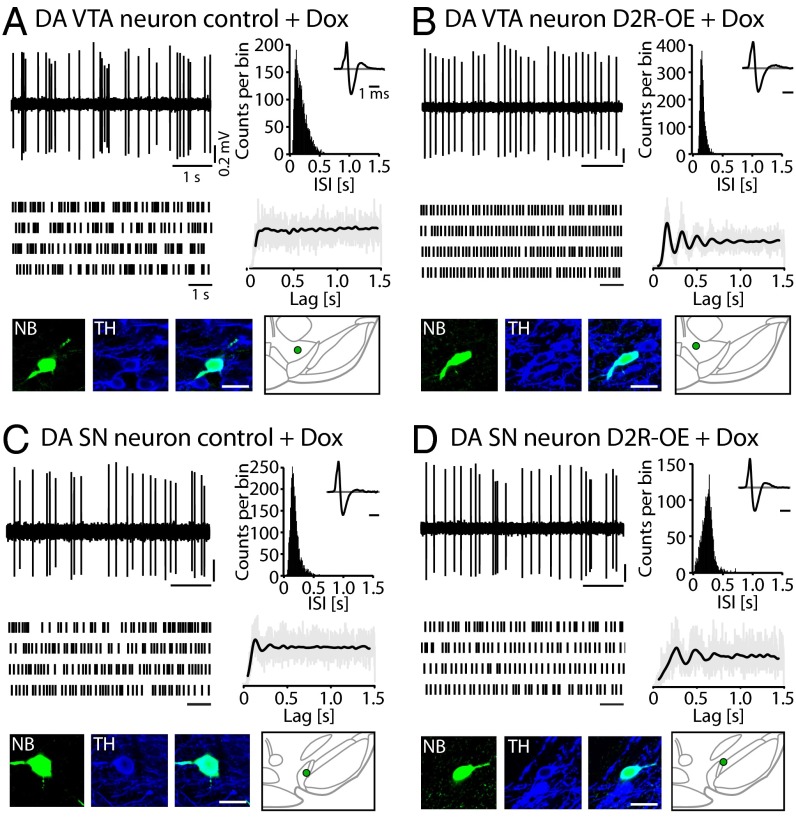
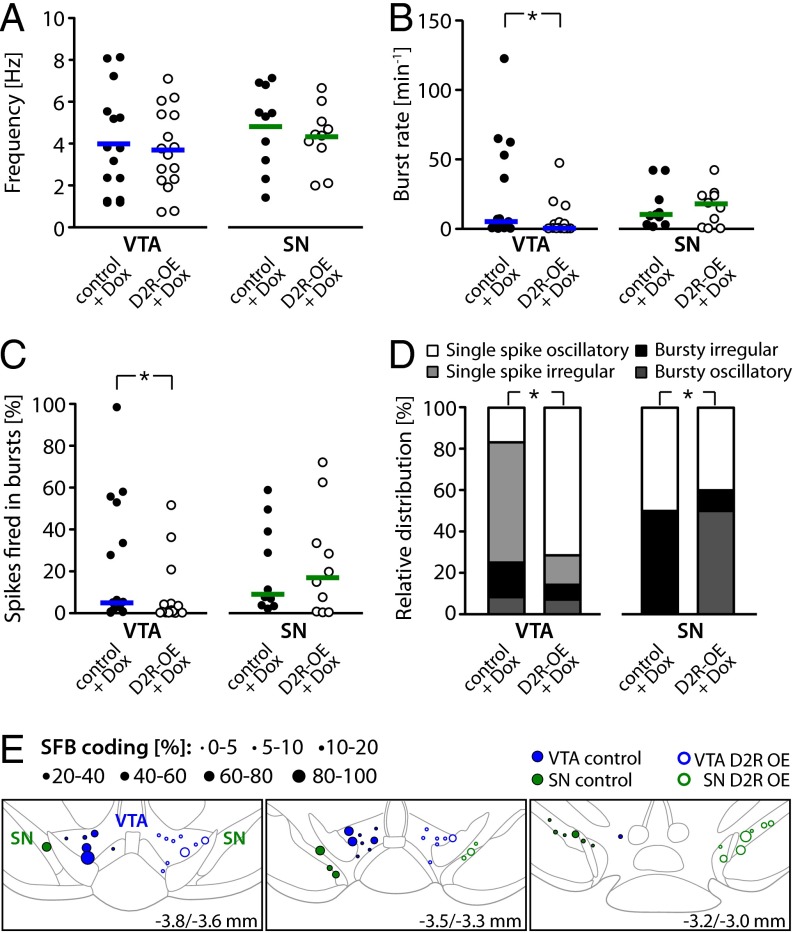
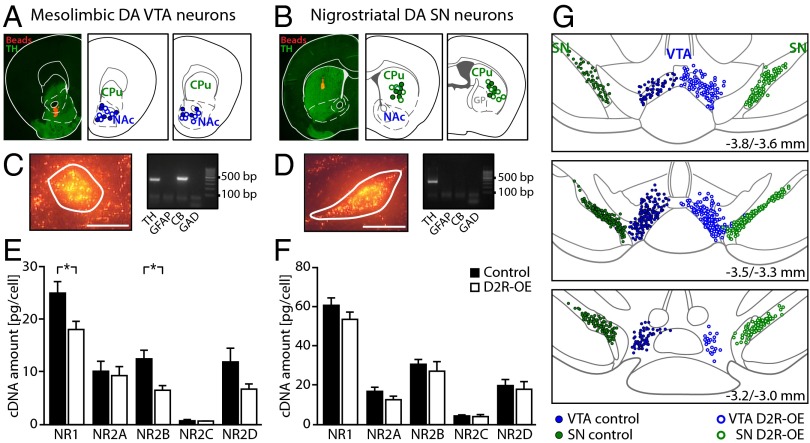
There is strong evidence that the core deficits of schizophrenia result from dysfunction of the dopamine (DA) system, but details of this dysfunction remain unclear. We previously reported a model of transgenic mice that selectively and reversibly overexpress DA D2 receptors (D2Rs) in the striatum (D2R-OE mice). D2R-OE mice display deficits in cognition and motivation that are strikingly similar to the deficits in cognition and motivation observed in patients with schizophrenia. Here, we show that in vivo, both the firing rate (tonic activity) and burst firing (phasic activity) of identified midbrain DA neurons are impaired in the ventral tegmental area (VTA), but not in the substantia nigra (SN), of D2R-OE mice. Normalizing striatal D2R activity by switching off the transgene in adulthood recovered the reduction in tonic activity of VTA DA neurons, which is concordant with the rescue in motivation that we previously reported in our model. On the other hand, the reduction in burst activity was not rescued, which may be reflected in the observed persistence of cognitive deficits in D2R-OE mice. We have identified a potential molecular mechanism for the altered activity of DA VTA neurons in D2R-OE mice: a reduction in the expression of distinct NMDA receptor subunits selectively in identified mesolimbic DA VTA, but not nigrostriatal DA SN, neurons. These results suggest that functional deficits relevant for schizophrenia symptoms may involve differential regulation of selective DA pathways.
Keywords: NMDA receptor; burst activity; dopamine D2 receptor; schizophrenia; ventral tegmental area.
Conflict of interest statement
The authors declare no conflict of interest.
Figures
Similar articles
-
Impaired recruitment of dopamine neurons during working memory in mice with striatal D2 receptor overexpression.Nat Commun. 2018 Jul 19;9(1):2822. doi: 10.1038/s41467-018-05214-4. Nat Commun. 2018. PMID: 30026489 Free PMC article.
-
Cav1.3 channels control D2-autoreceptor responses via NCS-1 in substantia nigra dopamine neurons.Brain. 2014 Aug;137(Pt 8):2287-302. doi: 10.1093/brain/awu131. Epub 2014 Jun 16. Brain. 2014. PMID: 24934288 Free PMC article.
-
Innately low D2 receptor availability is associated with high novelty-seeking and enhanced behavioural sensitization to amphetamine.Int J Neuropsychopharmacol. 2013 Sep;16(8):1819-34. doi: 10.1017/S1461145713000205. Epub 2013 Apr 10. Int J Neuropsychopharmacol. 2013. PMID: 23574629
-
Expression of receptors for insulin and leptin in the ventral tegmental area/substantia nigra (VTA/SN) of the rat: Historical perspective.Brain Res. 2016 Aug 15;1645:68-70. doi: 10.1016/j.brainres.2015.12.041. Epub 2015 Dec 28. Brain Res. 2016. PMID: 26731335 Review.
-
Alterations in dopamine release but not dopamine autoreceptor function in dopamine D3 receptor mutant mice.J Neurosci. 1998 Mar 15;18(6):2231-8. doi: 10.1523/JNEUROSCI.18-06-02231.1998. J Neurosci. 1998. PMID: 9482807 Free PMC article. Review.
Cited by
-
Insights About Striatal Circuit Function and Schizophrenia From a Mouse Model of Dopamine D2 Receptor Upregulation.Biol Psychiatry. 2017 Jan 1;81(1):21-30. doi: 10.1016/j.biopsych.2016.07.004. Epub 2016 Jul 14. Biol Psychiatry. 2017. PMID: 27720388 Free PMC article. Review.
-
Quinpirole ameliorates nigral dopaminergic neuron damage in Parkinson's disease mouse model through activating GHS-R1a/D2R heterodimers.Acta Pharmacol Sin. 2023 Aug;44(8):1564-1575. doi: 10.1038/s41401-023-01063-0. Epub 2023 Mar 10. Acta Pharmacol Sin. 2023. PMID: 36899113 Free PMC article.
-
Microinjection of a Dopamine-D1 Receptor Agonist into the Ventral Tegmental Area Reverses the Blocked Expression of Morphine Conditioned Place Preference by N-Methyl-D-Aspartate Receptor Antagonist.Adv Biomed Res. 2020 Oct 30;9:54. doi: 10.4103/abr.abr_11_20. eCollection 2020. Adv Biomed Res. 2020. PMID: 33457337 Free PMC article.
-
Magnetic Resonance Spectroscopy (MRS) and Positron Emission Tomography (PET) Imaging in Obsessive-Compulsive Disorder.Curr Top Behav Neurosci. 2021;49:231-268. doi: 10.1007/7854_2020_201. Curr Top Behav Neurosci. 2021. PMID: 33751502
-
Striatal dopamine 2 receptor upregulation during development predisposes to diet-induced obesity by reducing energy output in mice.Proc Natl Acad Sci U S A. 2018 Oct 9;115(41):10493-10498. doi: 10.1073/pnas.1800171115. Epub 2018 Sep 25. Proc Natl Acad Sci U S A. 2018. PMID: 30254156 Free PMC article.
References
-
- Bleuler E. Dementia Praecox or the Group of Schizophrenias. International Universities Press; New York: 1950. trans Zinkin J.
-
- Kraepelin E. Dementia Praecox and Paraphrenia. Kreiger Publishing Company; Huntington, NY: 1919. trans Barclay RM.
-
- APA . Diagnostic and Statistical Manual of Mental Disorders. 5th Ed American Psychiatric Publishing; Arlington, VA: 2013.
-
- Barch DM. The cognitive neuroscience of schizophrenia. Annu Rev Clin Psychol. 2005;1:321–353. - PubMed
-
- Rabinowitz J, et al. Negative symptoms have greater impact on functioning than positive symptoms in schizophrenia: Analysis of CATIE data. Schizophr Res. 2012;137(1-3):147–150. - PubMed
Publication types
MeSH terms
Substances
Grants and funding
LinkOut - more resources
Full Text Sources
Other Literature Sources
Molecular Biology Databases
