. 2015 Apr 3;290(14):8834-48.
doi: 10.1074/jbc.M114.620641. Epub 2015 Feb 10.

Activin/nodal signaling switches the terminal fate of human embryonic stem cell-derived trophoblasts

Affiliations

Activin/nodal signaling switches the terminal fate of human embryonic stem cell-derived trophoblasts

Prasenjit Sarkar et al. J Biol Chem. .

Abstract

Human embryonic stem cells (hESCs) have been routinely treated with bone morphogenetic protein and/or inhibitors of activin/nodal signaling to obtain cells that express trophoblast markers. Trophoblasts can terminally differentiate to either extravillous trophoblasts or syncytiotrophoblasts. The signaling pathways that govern the terminal fate of these trophoblasts are not understood. We show that activin/nodal signaling switches the terminal fate of these hESC-derived trophoblasts. Inhibition of activin/nodal signaling leads to formation of extravillous trophoblast, whereas loss of activin/nodal inhibition leads to the formation of syncytiotrophoblasts. Also, the ability of hESCs to form bona fide trophoblasts has been intensely debated. We have examined hESC-derived trophoblasts in the light of stringent criteria that were proposed recently, such as hypomethylation of the ELF5-2b promoter region and down-regulation of HLA class I antigens. We report that trophoblasts that possess these properties can indeed be obtained from hESCs.

Keywords: Activin; Activin/Nodal Signaling; BMP Signaling; Bone Morphogenetic Protein (BMP); Differentiation; ELF5; Embryonic Stem Cell; Human Embryonic Stem Cells; Trophoblast.


Figures

FIGURE 1.
FIGURE 1.
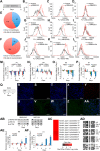
SB431542 treatment of hESCs causes expression of P63. A, schematic of protocol showing treatment of hESCs with SB431542 for 6 days. B–D, flow cytometry analysis of H1 cells showing the presence of phospho-SMAD2/3 at day 0 (B), day 1 of treatment with SB431542 (C), and day 6 of treatment with SB431542 (D). Shown is a comparison of membrane fraction from undifferentiated H9 cells and H9 cells treated with SB431542 for 6 days, using SILAC, to show up-regulation of membrane proteins that are found in trophoblasts (E) and in neuroectoderm (F). G–I, flow cytometry analysis of H9 cells showing the presence of phospho-SMAD2/3 at day 0 (G), day 1 of treatment with SB431542 (H), and day 6 of treatment with SB431542 (I). J–L, flow cytometry analysis of H9 cells showing the presence of phospho-SMAD1/5/8 at day 0 (J), day 6 of treatment with SB431542 (K), and day 2 of control treatment with Noggin, DMH1, and SB431542 (L). Shown is expression of T (brachyury), TBX4, LMO2, and KDR after treatment of H1 (M) and H9 cells (N) with SB431542. Shown is expression of MSI1 (musashi 1), NES (nestin), and OLIG3 after treatment of H9 (O) and H1 cells (P) with SB431542. Three biological replicates were used for H9 cells (N and O), and one biological replicate was used for H1 cells (M and P). Error bars, S.E. *, statistically significant changes (p < 0.05). Q, Western blot for PAX6 in H9 cells treated with SB431542. 20 μg protein was loaded in each well. R–W, confocal image showing staining for DAPI (R), P63 (S), and merged (T) in H1 cells at day 0, and DAPI (U), P63 (V), and merged (W) in H1 cells at day 4 of treatment with SB431542. X–AA, confocal image showing staining for DAPI (X), P63 (Y), phospho-SMAD1/5/8 (Z), and merge (AA) in H9 cells at day 4 of treatment with SB431542. Isotype controls did not show staining (data not shown). AB, Western blot showing the presence of phospho-SMAD1/5/8 and phospho-ERK1/2 in both untreated H9 cells and H9 cells treated with SB431542. AC, comparison of cytoplasmic fraction from undifferentiated H9 cells and H9 cells treated with SB431542 for 6 days, using SILAC, to show up-regulation of cytokeratins that are found in trophoblasts. AD, methylation levels of ELF5-2b promoter locus in hESCs and in hESCs treated with SB431542. Data represent DNA sequences sampled randomly from one biological sample. Another biological replicate yielded similar data (data not shown). AE and AF, expression of CDX2 and ELF5 in H9 (AE) and H1 cells (AF) treated with SB431542.
FIGURE 2.
FIGURE 2.
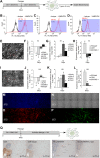
HESCs are not epigenetically restricted from differentiating to trophoblasts. A, protocol for prolonged SB431542 treatment with inclusion of a passage step. B, DIC image showing formation of mesenchymal cells after 12 days of SB431542 treatment of H9 cells. C, comparison of membrane fraction from undifferentiated H9 cells and H9 cells treated with SB431542 for 12 days, using SILAC, to show down-regulation of HLA antigens. D, flow cytometry analysis showing staining for vimentin in cells obtained from 10 days of SB431542 treatment of H9 cells. E, schematic of the protocol for isolating epithelial cells from SB431542-treated cultures using 1-h collagenase treatment. F, DIC image showing epithelial patches in H1 cells treated with SB431542 for 12 days. G and H, DIC image showing these epithelial patches lifting off of the plate after 1-h collagenase treatment (G), whereas mesenchymal cells remain attached to the plate after 1-h collagenase treatment (H). I, flow cytometry analysis showing vimentin staining in isolated epithelial cells. J and K, expression of CDX2, ELF5, and EOMES in these epithelial cells obtained from differentiated H1 (J) and H9 (K) cultures. Three biological replicates were used for both H1 and H9 cells. Error bars, S.E. *, statistically significant changes (p < 0.05). L, methylation levels of ELF5-2b promoter locus in isolated epithelial cells from SB431542 treatment. Data represent DNA sequences sampled randomly from one biological sample. Another biological replicate yielded similar data (data not shown).
FIGURE 3.
FIGURE 3.
Continued SB431542 treatment after passage leads to iCTB formation. A, protocol for SB431542 treatment to form mesenchymal cells and isolation of mesenchymal cells using short trypsin exposure. B–D, mesenchymal cells were isolated from biological triplicate cultures of SB431542-treated H9 cells. Purity of mesenchymal cells was assessed using flow cytometry analysis for vimentin, showing >95% purity. E, an invasion assay of mesenchymal cells obtained from SB431542-treated H9 cells was carried out on Geltrex-coated membrane inserts in duplicate. The image shows the presence of mesenchymal cells on the lower surface of the membrane (arrows indicate nuclei). F–H, expression of CDX2, EOMES, ELF5, HAND1, CDH11, ITGA5, PLAU, IGTA1, PECAM1, CSH1, and ERVFRD-1 (syncytin-2) in H1-derived mesenchymal cells. Three biological replicates were used. Error bars, S.E. *, statistically significant changes (p <0.05). I, invasion assay of mesenchymal cells obtained from SB431542-treated H1 cells was carried out on Geltrex-coated membrane inserts in duplicate. The image shows the presence of mesenchymal cells on the lower surface of the membrane (arrows indicate nuclei). J–L, expression of CDX2, EOMES, ELF5, HAND1, CDH11, HLA-G, PLAU, IGTA1, PECAM1, CSH1, and ERVFRD-1 (syncytin-2) in H9-derived mesenchymal cells. Three biological replicates were used. Error bars, S.E. *, statistically significant changes (p < 0.05). M, confocal image showing staining for DAPI; N, DIC image showing mesenchymal cells; O, staining for VE-cadherin; P, staining for CD9 in H9-derived mesenchymal cells. Q, protocol for obtaining mesenchymal cells from SB431542-treated cells through three-dimensional Matrigel culture. R and S, immunohistochemistry showing staining for CD9 (R) and isotype (S) in H9-derived mesenchymal cells. Arrow, zone of EMT. T and U, immunohistochemistry showing staining for VE-cadherin (indicated by arrows) (T) and isotype (U) in H9-derived mesenchymal cells.
FIGURE 4.
FIGURE 4.
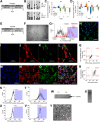
Activation of activin/nodal signaling after passage leads to STB formation. A, protocol for SB431542 treatment and subsequent activation of activin/nodal signaling to obtain syncytial cells. B and C, H1 cells were treated with SB431542 for 6 days and passaged in MEF-CM for 4 days. Flow cytometry analysis showing staining for isotype control (B) and phospho-SMAD2/3 (C). D, H9 cells were treated with SB431542 for 6 days and passaged into MEF-CM for 6 days. The confocal image shows staining for plasma membrane (red) and nuclei (blue). Arrows, cells with multiple nuclei. E, H1 cells were treated with SB431542 for 6 days and passaged into MEF-CM for 8 days and stained with propidium iodide. Flow cytometry analysis shows multiple peaks corresponding to integer multiples of nuclei in the analyzed cells. F–I, expression of CSH1, CGB, HSD3B1, and PSG9 in H1 and H9 cells exposed to the protocol in A. Three biological replicates were used for H1 and H9 cells. Error bars, S.E. *, statistically significant changes (p < 0.05). J, ELISA showing the amount of β-hCG present in MEF-CM and in media conditioned by STBs from H1 cells and H9 cells. *, statistically significant values (p < 0.05).
FIGURE 5.
FIGURE 5.
Hypomethylation of ELF5-2b promoter locus and derivation of iCTBs from BMP-treated hESCs. A, schematic of the protocol for prolonged treatment with SB431542 and BMP4, including a passage step, for obtaining cells with hypomethylation of the ELF5-2b promoter locus. B, methylation levels of ELF5-2b promoter locus in hESCs treated with BMP4 and SB431542. Data represent DNA sequences sampled randomly from one biological sample. Another biological replicate yielded similar data (data not shown). C and D, expression of T (brachyury), TBX4, and KDR in differentiated cells. Three biological replicates were used for H9 cells, and one biological replicate was used for H1 cells. Error bars, S.E. *, statistically significant changes (p < 0.05). E, schematic of the protocol for obtaining mesenchymal cells from hESCs treated with SB431542 and BMP4, by passaging them into MEF-CM with EGF and SB431542. F, DIC image showing mesenchymal cells obtained from H9 cultures. G, mesenchymal cells from H9 cultures were harvested using 2-min trypsin exposure. Flow cytometry analysis shows staining for vimentin in harvested mesenchymal cells. H, confocal image showing staining for HLA-G in H9-derived mesenchymal cells. I–L, confocal image showing staining for DAPI (I), CK-7 (J), VE-cadherin (K), and merge (L), in H1-derived mesenchymal cells. M–P, confocal image showing staining for DAPI (M), CK-7 (N), VE-cadherin (O), and merged (P) in H9-derived mesenchymal cells. Q–R, flow cytometry analysis showing co-expression of VE-cadherin and CD9 in H1-derived mesenchymal cells. S and T, flow cytometry analysis showing expression of VE-cadherin in H9-derived mesenchymal cells. U and V, flow cytometry analysis showing expression of CD9 in H9-derived mesenchymal cells. A zymogram shows degradation of gelatin and subsequent clear band at ∼150 kDa by the conditioned medium obtained from differentiated hESC cultures (W), whereas MEF-CM does not show any clear bands on the zymogram (gel shows region from 40 to 260 kDa) (X). Y, invasion assay of mesenchymal cells obtained from H9 cultures, showing the presence of mesenchymal cells on the lower surface of a Geltrex-coated membrane insert.
FIGURE 6.
FIGURE 6.
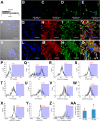
Activation of activin/nodal signaling after passage leads to syncytiotrophoblast formation in BMP-treated hESCs. A, schematic of the protocol for obtaining syncytial cells from hESCs treated with SB431542 and BMP4, by passaging them into MEF-CM containing EGF. B–E, confocal image showing staining for DAPI (B), β-hCG (C), syncytin-1 (D), and merge (E) in differentiated H9 cells. F, DIC image showing flattened multinucleate cells in differentiated H9 cultures. G–J, confocal image showing staining for DAPI (G), CK-7 (H), syncytin-1 (I), and merge (J), in differentiated H9 cultures. K, DIC image showing flattened multinucleate cells in differentiated H1 cultures. L–O, confocal image showing staining for DAPI (L), CK-7 (M), syncytin-1 (N), and merge (O) in differentiated H1 cultures. Flow cytometry analysis shows expression of CK-7 (P–Q) and syncytin-1 (R–S) in differentiated H9 cultures. Flow cytometry analysis shows expression of CK-7 (T–U) and syncytin-1 (V–W) in differentiated H1 cultures. X, H1 cells were treated with SB435142 and BMP for 6 days and passaged into MEF-CM containing EGF for 4 days. Y, flow cytometry analysis shows staining for isotype and phospho-SMAD2/3 in these cells. Z, H1 cells were subjected to the protocol in A and stained with propidium iodide. Flow cytometry analysis shows the presence of multiple peaks corresponding to integer multiples of nuclei in analyzed cells. AA, ELISA showing the amount of β-hCG secreted into the medium by STBs derived from H1 and H9 cells. *, statistically significant values (p <0.05).

Similar articles

Cited by

References

    1. Xu R.-H., Chen X., Li D. S., Li R., Addicks G. C., Glennon C., Zwaka T. P., Thomson J. A. (2002) BMP4 initiates human embryonic stem cell differentiation to trophoblast. Nat. Biotechnol. 20, 1261–1264 - PubMed
    1. Gerami-Naini B., Dovzhenko O. V., Durning M., Wegner F. H., Thomson J. A., Golos T. G. (2004) Trophoblast differentiation in embryoid bodies derived from human embryonic stem cells. Endocrinology 145, 1517–1524 - PubMed
    1. Matin M. M., Walsh J. R., Gokhale P. J., Draper J. S., Bahrami A. R., Morton I., Moore H. D., Andrews P. W. (2004) Specific knockdown of Oct4 and β2-microglobulin expression by RNA interference in human embryonic stem cells and embryonic carcinoma cells. Stem Cells 22, 659–668 - PubMed
    1. Hay D. C., Sutherland L., Clark J., Burdon T. (2004) Oct-4 knockdown induces similar patterns of endoderm and trophoblast differentiation markers in human and mouse embryonic stem cells. Stem Cells 22, 225–235 - PubMed
    1. Hyslop L., Stojkovic M., Armstrong L., Walter T., Stojkovic P., Przyborski S., Herbert M., Murdoch A., Strachan T., Lako M. (2005) Downregulation of NANOG induces differentiation of human embryonic stem cells to extraembryonic lineages. Stem Cells 23, 1035–1043 - PubMed

Publication types