. 2015 Apr 1;128(7):1434-43.
doi: 10.1242/jcs.165472. Epub 2015 Feb 6.

The multivesicular body is the major internal site of prion conversion

Affiliations

The multivesicular body is the major internal site of prion conversion

Yang-In Yim et al. J Cell Sci. .

Abstract

The conversion of the properly folded prion protein, PrPc, to its misfolded amyloid form, PrPsc, occurs as the two proteins traffic along the endocytic pathway and PrPc is exposed to PrPsc. To determine the specific site of prion conversion, we knocked down various proteins in the endocytic pathway including Rab7a, Tsg101 and Hrs (also known as HGS). PrPsc was markedly reduced in two chronically infected cell lines by preventing the maturation of the multivesicular body, a process that begins in the early endosome and ends with the sorting of cargo to the lysosome. By contrast, knocking down proteins in the retromer complex, which diverts cargo away from the multivesicular body caused an increase in PrPsc levels. These results suggest that the multivesicular body is the major site for intracellular conversion of PrPc to PrPsc.

Keywords: Conversion; Multivesicular body; Prion; Scrapie.


Figures

Fig. 1.
Fig. 1.
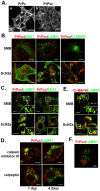
Effect of calpain inhibitors on the localization of PrPsc in SMB and ScN2a cells. (A) Immunostaining of SMB cells with anti-PrP antibody before (a) and after (b) 5 M GdnHCl treatment. Cells were immunostained with SAF32 and AH6 antibody to detect both PrPc and PrPsc, respectively. The confocal settings used in imaging PrPsc do not detect PrPc. (B) Immunostaining of SMB and ScN2a cells for PrPsc and different marker proteins in the endocytic pathway in non-treated cells. (C) Effect of overnight incubation of SMB cells with MDL-28170 on PrPsc localization. SMB and ScN2a cells were stained for PrPsc and either LAMP1 or EEA1. (D) Immunostained PrPsc and LAMP1 in SMB cells incubated with either calpain inhibitor IV or calpeptin for the indicated times. (E) Immunostaining of SMB and ScN2a cells for CI-M6PR and LAMP1 following overnight incubation with MDL-28170. Insets are an enlargement of the boxed area. (F) Super-resolution image of PrPsc and LAMP1 in SMB cells incubated overnight with MDL-28170. Scale bars: 10 µm (A–E), 1 µm (F).
Fig. 2.
Fig. 2.
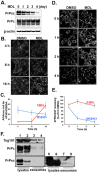
Clearance of PrPsc by calpain inhibitors is not due to a decrease in cellular PrPc, an increase in endosomal proteolytic activity or the release of PrPsc-laden exosomes. (A) Western blot of PrPc and PrPsc in cells following different times of incubation with MDL-28170 (50 µM). Actin was used as an internal loading control. (B) DQ-Red–BSA fluorescence monitoring proteolytic activity of the endolysomal compartment. DQ-Red–BSA (10 µg/ml) was internalized for 15 min in SMB cells treated overnight with DMSO (control) or 50 µM MDL. Cells were washed and incubated further in regular medium and imaged at the indicated times. (C) Quantification of the fluorescence intensity of DQ-Red–BSA fluorescence from cells scanned at the indicated times. The DQ-Red fluorescence intensity was measured using Metamorph analysis at the different time points. (D) MDL treatment reduces the rate of degradation of EGF. SMB cells were treated for 1 day either with DMSO (control) or MDL. Both groups of cells were serum starved for 4 h before incubating cells for 15 min with Alexa-Fluor-555–EGF (500 ng/ml). The EGF was then washed out, complete medium was added, and then cells were imaged at the indicated times. (E) Time course of EGF degradation in control and MDL-treated cells. The data were normalized to the intensity of the control cells obtained after washing out the EGF. The EGF intensity was measured using Metamorph analysis at the different time points. Data in C and E are mean±s.d. (n = 5). (F) Examination of PrP in exosome-enriched population. A western blot probing for Tsg101, PrPc, and PrPsc in cell lysates and exosome-enriched preparation is shown. After growing SMB cells for 4 days in the absence (lanes 1, 3, 5 and 7) and presence of MDL-28170 (lanes 2, 4, 6 and 8), cells and medium were collected to prepare cell lysates (lanes 1, 2, 5 and 6) and an exosome-enriched population (lanes 3, 4, 7 and 8). The same blot shown in lanes 1–4 were exposed for a longer time (lanes 5–8). Scale bars: 10 µm (B,D).
Fig. 3.
Fig. 3.
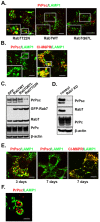
Clearance of PrPsc is due to lack of maturation of the MVBs. (A) Effect of overexpressing different Rab7a constructs on the localization of PrPsc and LAMP1. SMB cells were immunostained for PrPsc (red) and LAMP1 (green) at 3 days after transfection with Rab7(T22N), Rab7(WT) or Rab7(Q67L). (B) The stable SMB cell line expressing GFP–Rab7(T22N) clears PrPsc from the MVB. Cells were stained with LAMP1 and either PrPsc or M6PR (red). (C) Western blot of PrPsc and PrPc in lysates from SMB cells stably expressing the indicated GFP–Rab7 constructs. Actin was used as an internal loading control. (D) Western blot of PrPsc and PrPc in lysates from SMB cells depleted of Rab7a. (E) Immunostaining of PrPsc and LAMP1 in SMB cells in cells treated once (day 3) and twice (day 7) with siRNAs oligonucleotides to knockdown Rab7a. (F) Super-resolution image of PrPsc and LAMP1 in SMB cells partially depleted of Rab7. Insets are an enlargement of the boxed area. Scale bars: 10 µm (A,B,E), 1 µm (F).
Fig. 4.
Fig. 4.
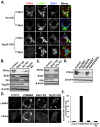
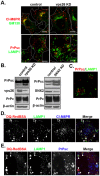
Knocking down Hrs or Tsg101 alters PrPsc localization and decreases the level of PrPsc. (A) Hrs or Tsg101 was knocked down (KD) for the indicated times before immunostaining. The merge image shows PrPsc (red), LAMP1 (green) and EEA1 (blue). (B) Western blot of PrPsc and PrPc in lysates from control and in cells knocked down for the following proteins: Rab7a, Hrs, Tsg101. (C) Western blot of PrPsc in lysates from SMB cells depleted of Alix. (D) Western blot of PrPsc in lysates prepared from SMB cells stably expressing the indicated Rab constructs. Immunoblots were probed with antibodies against PrP and actin. (E) Filipin staining of SMB cells grown under different conditions. Control cells, cells incubated in U18666A (50 µM final concentration) for 2 days, Rab7a-knockdown cells, and Tsg101-knockdown cells were stained with filipin and anti-LAMP1 antibody. Scale bar, 10 µm. (F) Relative cholesterol levels under different conditions. Data (mean±s.d., n = 10) were normalized by setting the intensity of the background and U18666A-treated cells to 0% and 100%, respectively.
Fig. 5.
Fig. 5.
Knocking down Vps26 alters PrPsc localization and increases the level of PrPsc. (A) Control and Vps26-knockdown (KD) cells were stained with the indicated antibodies. (B) Western blots of PrPsc and PrPc in lysates from control and Vps26-knockdown cells and SNX-2 knockdown cells. Actin was loaded as an internal loading control. (C) Super-resolution image of PrPsc and LAMP1 in Vps26-knock down cell. (D) Colcalization of the fluorescence endosomal proteolytic indicator DQ-Red–BSA, in control cells with different endosomal markers. Cells were fixed after internalizing DQ-Red–BSA (10 µg/ml) for 4 h at 37°C and then immunostained. The merge image shows proteolyzed DQ-Red–BSA (red), LAMP1 (green) and CI-M6PR (blue). Endosomes with high proteolytic activity that are LAMP1-positive and CI-M6PR-negative, and LAMP-positive and CI-M6PR positive are indicated by the arrowheads and arrows, respectively. (E) PrPsc localizes to MVBs in Vps26-knockdown cells. After internalizing DQ-Red–BSA (red), cells were stained for LAMP1 (green) and PrPsc (blue). The asterisks indicate LAMP1-positive endosomes that are positive for PrPsc and have low DQ-Red–BSA fluorescence. The arrowheads indicate LAMP1-positive endosomes with no detectable PrPsc and high DQ-Red BSA fluorescence. Scale bars: 10 µm (A,D,E), 1 µm (C).
Fig. 6.
Fig. 6.
Model of cellular trafficking of PrPc and PrPsc. Following the internalization of PrP and PrPsc, these proteins are sorted in the early endosome (EE) either to be recycled to the plasma membrane via the recycling endosome (RE) or to traffic along the endolysosomal pathway. PrPc is converted into PrPsc in the MVB and the PrPsc is either recycled back to the plasma membrane or degraded in the lysosome (Lys). Recycling to the plasma membrane (dashed arrows) occurs via a retromer-dependent pathway, but it is not yet clear whether cargo is transferred to the TGN prior to reaching the plasma membrane. PrPsc is also released into the medium when the MVB fuses with the plasma membrane to release its intraluminal vesicles as exosomes.

Similar articles

Cited by

References

    1. Alais S., Simoes S., Baas D., Lehmann S., Raposo G., Darlix J. L., Leblanc P. (2008). Mouse neuroblastoma cells release prion infectivity associated with exosomal vesicles. Biol. Cell 100, 603–618 10.1042/BC20080025 - DOI - PubMed
    1. Ali N., Zhang L., Taylor S., Mironov A., Urbé S., Woodman P. (2013). Recruitment of UBPY and ESCRT exchange drive HD-PTP-dependent sorting of EGFR to the MVB. Curr. Biol. 23, 453–461. - PubMed
    1. Baron G. S., Magalhães A. C., Prado M. A., Caughey B. (2006). Mouse-adapted scrapie infection of SN56 cells: greater efficiency with microsome-associated versus purified PrP-res. J. Virol. 80, 2106–2117 10.1128/JVI.80.5.2106-2117.2006 - DOI - PMC - PubMed
    1. Béranger F., Mangé A., Goud B., Lehmann S. (2002). Stimulation of PrP(C) retrograde transport toward the endoplasmic reticulum increases accumulation of PrP(Sc) in prion-infected cells. J. Biol. Chem. 277, 38972–38977 10.1074/jbc.M205110200 - DOI - PubMed
    1. Bonifacino J. S., Hurley J. H. (2008). Retromer. Curr. Opin. Cell Biol. 20, 427–436 10.1016/j.ceb.2008.03.009 - DOI - PMC - PubMed

Publication types

LinkOut - more resources