. 2015 Feb 6:6:6115.
doi: 10.1038/ncomms7115.

Small heterodimer partner interacts with NLRP3 and negatively regulates activation of the NLRP3 inflammasome

Affiliations

Small heterodimer partner interacts with NLRP3 and negatively regulates activation of the NLRP3 inflammasome

Chul-Su Yang et al. Nat Commun. .

Abstract

Excessive activation of the NLRP3 inflammasome results in damaging inflammation, yet the regulators of this process remain poorly defined. Herein, we show that the orphan nuclear receptor small heterodimer partner (SHP) is a negative regulator of NLRP3 inflammasome activation. NLRP3 inflammasome activation leads to an interaction between SHP and NLRP3, proteins that are both recruited to mitochondria. Overexpression of SHP competitively inhibits binding of NLRP3 to apoptosis-associated speck-like protein containing a CARD (ASC). SHP deficiency results in increased secretion of proinflammatory cytokines IL-1β and IL-18, and excessive pathologic responses typically observed in mouse models of kidney tubular necrosis and peritoneal gout. Notably, the loss of SHP results in accumulation of damaged mitochondria and a sustained interaction between NLRP3 and ASC in the endoplasmic reticulum. These data are suggestive of a role for SHP in controlling NLRP3 inflammasome activation through a mechanism involving interaction with NLRP3 and maintenance of mitochondrial homeostasis.


Figures

Figure 1
Figure 1. SHP interacts with NLRP3 during inflammasome activation.
(a) Small heterodimer partner (SHP) complexes purified from lipopolysaccharide (LPS)-primed bone marrow-derived macrophages (BMDMs) with or without adenosine triphosphate (ATP, 1 mM) stimulation were subjected to mass spectrometry analysis. Red letters indicate the peptides identified. (b) Lipopolysaccharide (LPS)-primed BMDMs were stimulated with ATP for the indicated durations, and subjected to co-immunoprecipitation (co-IP) with antibodies for SHP (left) or NOD-like receptor family, pyrin domain-containing 3 (NLRP3; right), followed by immunoblotting (IB) with antibodies for NLRP3, apoptosis-associated speck-like protein containing a carboxy-terminal CARD (ASC), SHP and actin. (c) LPS-primed BMDMs from SHP+/+ and SHP−/− mice were stimulated with ATP for 30 min, fixed, immunostained with antibodies for SHP (Alexa 488) and NLRP3 (Alexa 568), and counterstained with DAPI (blue). Upper immunofluorescence images are representative of three independent replicates; scale bar, 10 μm. (d) Schematic diagram of the structures of SHP (Left) and NLRP3 (Right). (eg) 293T cells were co-transfected with a control vector, Flag-NLRP3 or truncated mutants (ΔPYD, ΔNACHT, ΔLRR), together with V5-SHP or its mutants (N-terminal or C-terminal). Cells were subjected to co-IP with antibodies for V5 (e) or Flag (f,g), followed by IB with antibodies for Flag or V5. (h) Schematic diagram of N-terminal deletions of SHP structure. ‘--’ indicates a deleted sequence. (i) 293T cells were co-transfected with the indicated constructs, and subjected to co-IP with anti-Flag, followed by IB analysis with antibodies for GFP or Flag. (j,k) 293T cells were co-transfected with Flag-NLRP3 or AU1-ASC, together with increasing amounts of V5-SHP, and subjected to co-IP with antibodies for Flag (j) or AU1 (k), followed by IB analysis with antibodies for Flag, AU1 or V5. Data are representative of at least three independent experiments (ac,eg and ik). Protein levels in cell lysates were determined by IB analysis (eg and ik). U, untreated control.
Figure 2
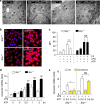
Figure 2. SHP deficiency increases caspase-1 cleavage and IL-1β maturation.
(ae) LPS-primed BMDMs from SHP+/+ and SHP−/− mice were stimulated with ATP (5 mM, a,d), nigericin (15 μM, b,e), or transfected with polyinosine–polycytidylic acid (poly I:C, 5 μg ml−1, c) for the indicated durations. (ac) Supernatants were collected and subjected to ELISA for interleukin (IL)-1β, IL-18 and tumour necrosis factor (TNF)-α. (d,e) IB analysis for IL-1β p17 or caspase-1 p10 in supernatants (SN), SHP, pro-IL-1β or pro-caspase-1 in whole-cell lysates (WCL). Actin was used as a loading control. *P<0.05; **P<0.01; ***P<0.001, compared with SHP+/+ cell cultures (two-tailed Student’s t-test). Data are the means±s.d. of values from four independent experiments (ac). Data are representative of three independent experiments with similar results (d,e).
Figure 3
Figure 3. SHP inhibits the signal 2 activation of NLRP3 inflammasome.
(a,b) LPS-primed BMDMs were treated with fenofibrate (10, 20, 50 μM for 4 h), or (c,d) LPS-primed THP-1 cells were treated with recombinant macrophage-stimulating protein (MSP 10, 50, 100 ng ml−1 for 4 h), and then activated with ATP (5 mM) for 30 min, followed by IB analysis of IL-1β p17 or caspase-1 p10 in supernatants (SN), pro-IL-1β or pro-caspase-1 in whole-cell lysates (WCL), with actin as a loading control. Data are representative of three independent experiments (a,c). Supernatants were collected and subjected to ELISA for IL-1β, IL-18, TNF-α and IL-8. Data are the means±s.d. of values from four independent experiments (b,d). *P<0.05; **P<0.01; ***P<0.001, compared with control (two-tailed Student’s t-test). FF, fenofibrate.
Figure 4
Figure 4. SHP deficiency exacerbates immunopathologic responses in vivo.
(ag) SHP+/+ and SHP−/− mice received either fenofibrate (100 mg kg−1; administrated orally), or a solvent control dose, for seven consecutive days before folic acid injection (250 mg kg−1; n=10 each group, intraperitoneally (i.p.); ag). (a) The survival of SHP+/+ and SHP−/− mice was monitored for 8 days. Significant differences in comparison with the control mice are indicated (log-rank test). (b) Weight loss of SHP+/+ and SHP−/− mice was monitored for the indicated durations. (c) IB analysis for IL-1β p17 or caspase-1 p10 from kidney homogenates. Actin was used as a loading control. (d) ELISA of IL-1β and IL-18 proteins in kidney homogenates. (e) Representative hematoxylin-eosin (H&E) stained images from kidneys at 36 h after folic acid treatment (left). ATN histology score as assessed by scoring of tubulointerstitial damage on H&E-stained kidney sections (right). Scale bar, 100 μm. (f,g) Representative immunofluorescence images of interstitial neutrophil infiltration (f, dotted lines) and IL-1β positive cells (g, dotted lines) at the corticomedullary junction of mouse kidney from each group. Scale bar, 20 μm. *P<0.05; **P<0.01; ***P<0.001, compared with control condition (two-tailed Student’s t-test). Data show the means±s.d. of values from five independent experiments (b,c and e right). Data are representative of three independent experiments with similar results (d,e left, f and g). U, untreated control; FF, fenofibrate; SC, solvent control.
Figure 5
Figure 5. SHP is required for mitochondrial translocation of NLRP3.
(a) BMDMs from SHP+/+ and SHP−/− mice were primed with LPS (100 ng ml−1; 4 h) and stimulated with ATP (5 mM) for the indicated durations. The cells were then subcellularly fractionated, subjected to co-IP with anti-NLRP3, followed by IB analysis with antibodies for NLRP3, ASC and SHP. Levels of actin and tubulin (cytoplasm), VDAC and COX IV (mitochondria), Calnexin (ER) and LAMP1 (lysosome) protein in each fraction were determined by IB analysis. Data are representative of three independent experiments with similar results. (b) LPS-primed BMDMs from SHP+/+ and SHP−/− mice were stimulated with ATP for 30 min. Co-expression of SHP (Alexa 488; green) with mitochondrial markers MitoTracker (middle) and cellular nuclei (DAPI) were visualized using immunofluorescence microscopy. Scale bar, 5 μm. Imaging data are representative of several images from three independent experiments. U, untreated control.
Figure 6
Figure 6. SHP is required for maintenance of mitochondrial homeostasis.
(a) Transmission electron microscopy (TEM) analysis of BMDMs from SHP+/+ and SHP−/− mice. Cells were unstimulated or stimulated with LPS/ATP. Black arrow, mitochondria. E, ER. N, Nucleus. Scale bar, 10 μm. (b) BMDMs from SHP+/+ and SHP−/− were stimulated with or without LPS/ATP for 30 min. Cells were then labelled with MitoSOX (red) or DAPI (blue; cell nuclei) and subjected to immunofluorescence microscopic analysis for measurement of mitochondrial reactive oxygen species (ROS). Scale bar, 20 μm. (c) Quantitative analysis of mean fluorescence intensities (MFI) of mitochondrial ROS. LPS-primed SHP+/+ and SHP−/− BMDMs were untreated or pretreated with fenofibrate (50 μΜ) for 1 h, and then stimulated with ATP for 30 min. (d,e) Quantitative real-time PCR analysis of cytosolic mtDNA. LPS-primed SHP+/+ and SHP−/− BMDMs were stimulated with ATP (5 mM) for the indicated durations (d). LPS-primed BMDMs were untreated or treated with fenofibrate and ATP stimulation (e). *P<0.05; ***P<0.001, compared with control condition (two-tailed Student’s t-test). Imaging data are representative of several images from three independent experiments (a,b). Data are presented as the means±s.d. of values from five independent experiments (ce). FF, fenofibrate; U, untreated control.
Figure 7
Figure 7. SHP deficiency induces NLRP3–ASC complex primarily localized to ER.
(ac) LPS-primed SHP+/+ and SHP−/− BMDMs were stimulated with ATP (5 mM) for the indicated durations (a) or 30 min (b,c). (a) The cells were then subcellularly fractionated, subjected to co-IP with anti-NLRP3, followed by IB analysis with antibodies for SHP, ASC, mitochondrial antiviral-signalling protein (MAVS), thioredoxin interacting protein (TXNIP), and NLRP3. Levels of Actin (cytosolic) and cytochrome c oxidase COX IV (mitochondrial) protein in each fraction were determined by IB analysis. (b) Cells were subcellularly fractionated and subjected to IB analysis with antibodies for NLRP3, ASC, SHP, TXNIP. Levels of tubulin (cytosolic), calnexin (endoplasmic reticulum (ER) and mitochondria-associated membrane (MAM)), fatty acid CoA ligase 4 (FACL4, MAM) and voltage-dependent anion channels (VDAC, mitochondrial) protein in each fraction were determined by IB analysis. (c) ER staining and three-dimensional analysis. Data are representative of three independent experiments with similar results (a–c). Scale bar, 2 μm. MAM, mitochondria-associated membrane; Mito, mitochondrial fraction.

Similar articles

Cited by

References

    1. Latz E. et al.. Activation and regulation of the inflammasomes. Nat. Rev. Immunol. 13, 397–411 (2013). - PMC - PubMed
    1. Zhang Y. et al.. Nuclear receptor SHP, a death receptor that targets mitochondria, induces apoptosis and inhibits tumor growth. Mol. Cell. Biol. 30, 1341–1356 (2010). - PMC - PubMed
    1. Garruti G. et al.. A pleiotropic role for the orphan nuclear receptor small heterodimer partner in lipid homeostasis and metabolic pathways. J. Lipids 2012, 304292 (2012). - PMC - PubMed
    1. Chanda D. et al.. Hepatocyte growth factor family negatively regulates hepatic gluconeogenesis via induction of orphan nuclear receptor small heterodimer partner in primary hepatocytes. J. Biol. Chem. 284, 28510–28521 (2009). - PMC - PubMed
    1. Yuk J. M. et al.. The orphan nuclear receptor SHP acts as a negative regulator in inflammatory signaling triggered by Toll-like receptors. Nat. Immunol. 12, 742–751 (2011). - PubMed

Publication types

MeSH terms