. 2015 Jun;87(6):1125-40.
doi: 10.1038/ki.2014.406. Epub 2015 Feb 4.

Dicer1 activity in the stromal compartment regulates nephron differentiation and vascular patterning during mammalian kidney organogenesis

Affiliations

Dicer1 activity in the stromal compartment regulates nephron differentiation and vascular patterning during mammalian kidney organogenesis

Naoki Nakagawa et al. Kidney Int. 2015 Jun.

Abstract

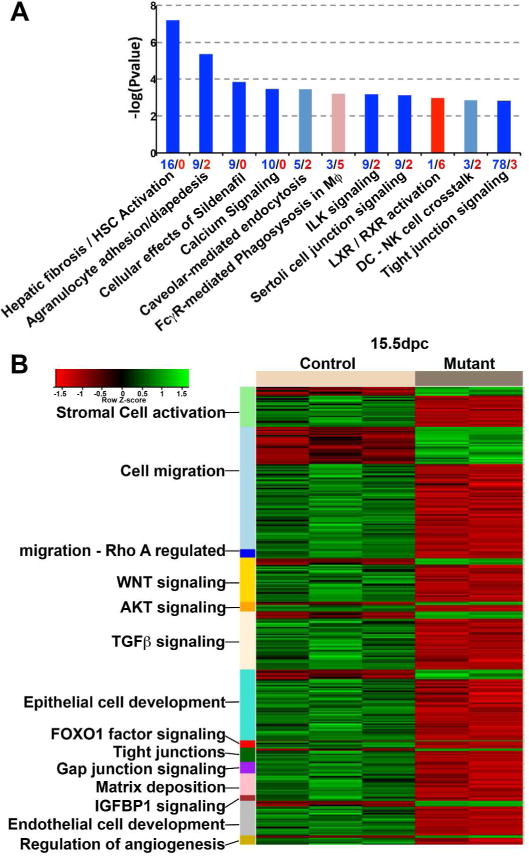
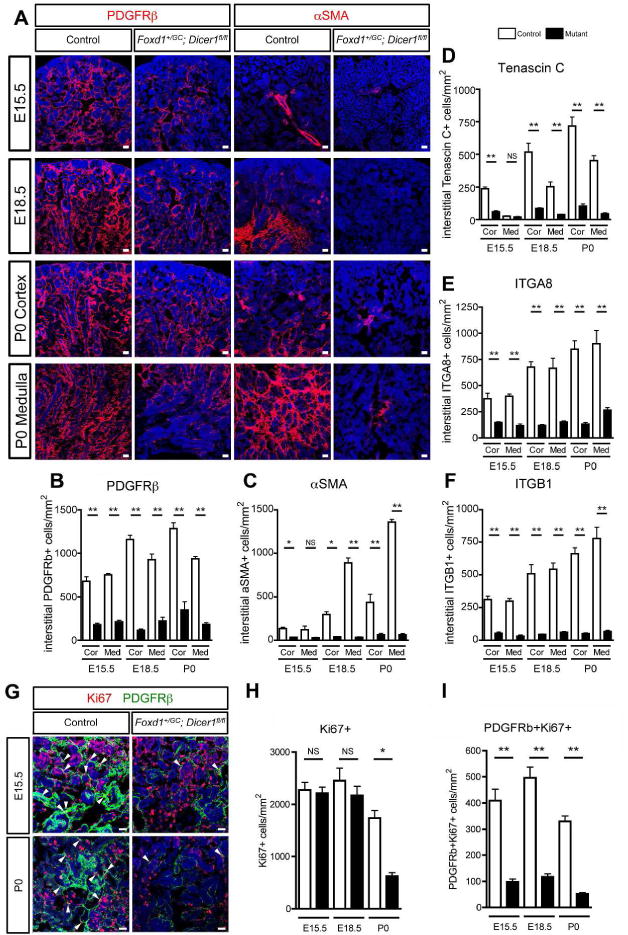
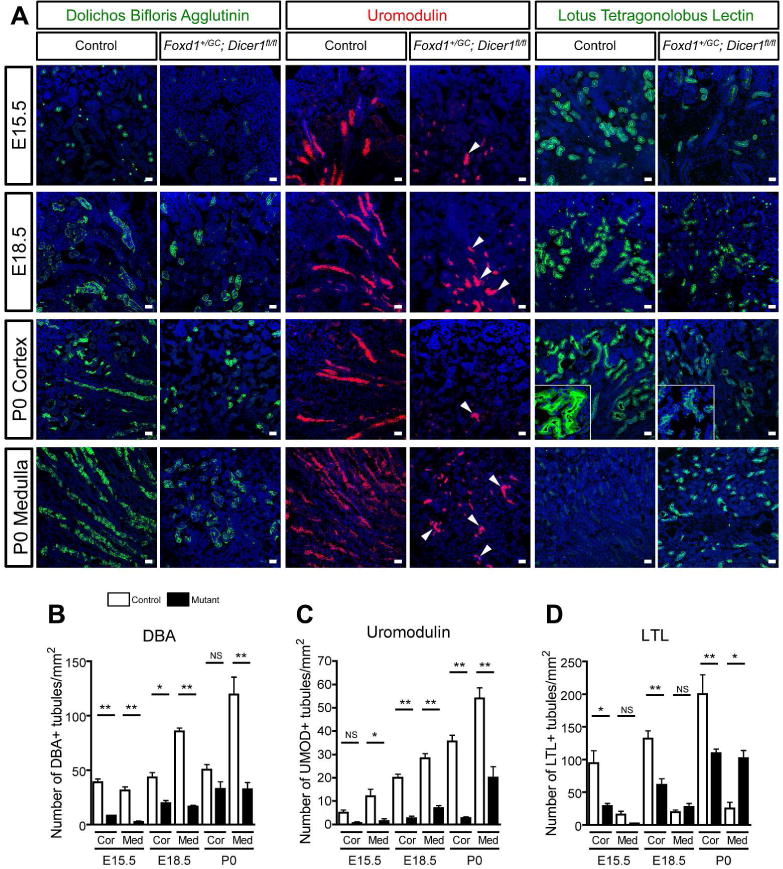
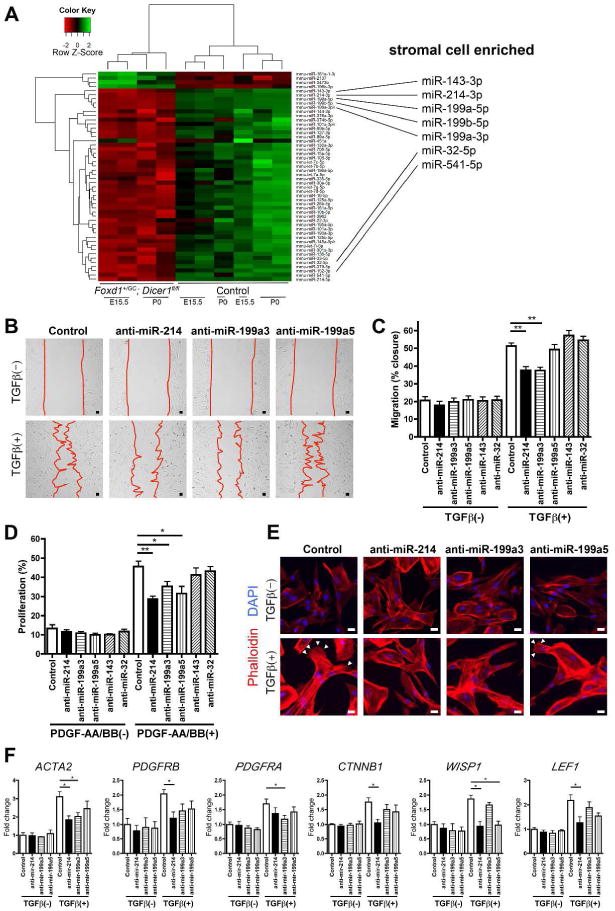
MicroRNAs, activated by the enzyme Dicer1, control post-transcriptional gene expression. Dicer1 has important roles in the epithelium during nephrogenesis, but its function in stromal cells during kidney development is unknown. To study this, we inactivated Dicer1 in renal stromal cells. This resulted in hypoplastic kidneys, abnormal differentiation of the nephron tubule and vasculature, and perinatal mortality. In mutant kidneys, genes involved in stromal cell migration and activation were suppressed as were those involved in epithelial and endothelial differentiation and maturation. Consistently, polarity of the proximal tubule was incorrect, distal tubule differentiation was diminished, and elongation of Henle's loop attenuated resulting in lack of inner medulla and papilla in stroma-specific Dicer1 mutants. Glomerular maturation and capillary loop formation were abnormal, whereas peritubular capillaries, with enhanced branching and increased diameter, formed later. In Dicer1-null renal stromal cells, expression of factors associated with migration, proliferation, and morphogenic functions including α-smooth muscle actin, integrin-α8, -β1, and the WNT pathway transcriptional regulator LEF1 were reduced. Dicer1 mutation in stroma led to loss of expression of distinct microRNAs. Of these, miR-214, -199a-5p, and -199a-3p regulate stromal cell functions ex vivo, including WNT pathway activation, migration, and proliferation. Thus, Dicer1 activity in the renal stromal compartment regulates critical stromal cell functions that, in turn, regulate differentiation of the nephron and vasculature during nephrogenesis.


Figures

Figure 1
Figure 1. Dicer1 inactivation in renal stromal progenitors results in neonatal lethality and profound disruption of nephrogenesis
(A) Gene map showing the site of recombination of genomic DNA in cells that activated Foxd1 (B) Kaplan-Meier plots showing survival after birth of mutant mice. (C) Immunodetection of DICER1 (arrowheads, interstitial positively stained cell) indicates absence in renal stromal cells of P0 mutant mice. Bar, 25 μm. (D) Wholemount urological tract from mutant vs control mice showing typical features including small kidney size, and empty small bladder. (E) Low power images of PAS stained kidneys showing characteristic abnormalities, including absence of papilla, shortened medulla and cystic changes. (F) Higher power PAS stained images of medulla and cortex showing typical changes including loss of papilla, shortened medulla and abnormalities of tubules including reduced brush border, dilatation of tubules, loss of polarization of epithelial cells (arrowheads), and glomerular abnormalities including cystic change and cuboidal glomerular morphology. Many podocytes retain an epithelial morphology. (G) The total number of glomeruli per unit area of the kidney was reduced and (H) the width of the nephrogenic zone is reduced. Bar, 25 μm. **P < 0.01, n = 3/group.
Figure 2
Figure 2. Global transcriptional analysis of kidneys from Foxd1+/GC; Dicer1fl/fl and control mice provides unbiased insight to the effect of Dicer1 mutation in stromal cells on nephrogenesis
(A) Pathways analysis of Foxd1+/GC; Dicer1fl/fl kidneys compared to control at E15.5 showing the most significantly regulated canonical pathways where red indicates mainly upregulated genes and blue, downregulated genes. Height of the bar reflects the statistical enrichment (−log10 P-value) for the pathways, while the numbers on the x-axis reflect the total number of regulated genes in each pathway (red = up, blue = down). (B) Heatmap showing subsets of the significantly differentially expressed genes comparing control and Foxd1+/GC; Dicer1fl/fl kidneys that belong to specific ontologies.
Figure 3
Figure 3. Dicer1 inactivation in renal stromal progenitors impairs their activity, patterning and expression of integrins
(A) Images of PDGFRβ and αSMA positive stromal cells of the developing kidney. Note that mutant stromal cells showed strikingly reduction in the expression of these genes at P0. (B–C) Quantification of number of PDGFRβ+ (B) and αSMA+ (C), Tenascin C+ (D), integrin α8+ (E) and integrin β1+ (F) stromal cells per unit area of kidney. (G) Images of Ki67− and PDGFRβ-expressing cells of the developing kidney. Note that mutant stromal cells show reduction in the expression of Ki67 at E15.5 and P0. Arrowheads indicate interstitial positively stained cells. (H–I) Quantification of number of Ki67+ (H) and Ki67+PDGFRβ+ (I) cells per unit area of kidney. Bar, 25 μm. *P < 0.05, **P < 0.01, n = 3/group.
Figure 4
Figure 4. Dicer1 inactivation in renal stromal progenitors results in impaired nephron elongation, segmentation and polarization
(A) Images showing markers of proximal tubule (LTL), collecting duct (DBA) and loop of Henle / Distal tubule (Uromodulin) differentiation in E15.5, E18.5 and P0 kidneys. Note the presence of proximal tubules in the medulla of mutant mice, and the loss of polarization of proximal tubules (inset). Note that expression of all markers is delayed in mutant embryos and that Uromodulin is almost absent in the cortex of mutant P0 kidneys. In the medulla, Uromodulin labels very short U-shaped turns in the tubules (arrowheads) in mutants whereas in controls the tubules are long and linear. (B–D) Quantification of positive stained tubules per unit area of kidney. Bar, 25 μm. *P < 0.05, **P < 0.01, n = 3/group.
Figure 5
Figure 5. Dicer1 inactivation in renal FOXD1 lineage results in abnormal podocyte differentiation
(A) Images of Foxd1−/ glomeruli. The failure of podocytes to mature from epithelial progenitors is readily apparent in Foxd1−/− kidneys by the persistence of cuboidal epithelial morphology. (B) Images showing expression of the mesenchymal transcriptional regulator WT1 in podocytes and the nephrogenic zone during nephrogenesis. Note that in mutant kidneys the expression of WT1 in glomerular cells is markedly reduced at E18.5 and P0 (inset). (C–D) Quantification of positive stained cells of WT1 in the nephrogenic zone (C) and glomeruli (D). (E) Quantification of glomerular fluorescence intensity of WT1. (F) Representative EM images showing lack of mesangium in mutant glomeruli. Note in mutant mice the podocytes show bigger and there is wrinkling and collapse of the capillary loop structure and extensive foot process effacement (arrowheads) (F) Quantification of podocytes diameter. Bar, 25 μm (A,B), 2 μm (E).
Figure 6
Figure 6. Dicer1 inactivation in renal stromal progenitors results in abnormal vascular patterning
(A) Images of CD31+ endothelium of the developing kidney. Note that at E15.5 many endothelial cells of the PTCs are not connected to one another in mutant kidneys (arrowheads) whereas in controls they already form a connected vasculature. In P0 kidney cortex, mutant capillaries are now connected but show very wide capillaries with enhanced branching (arrow). These differences were less apparent in the medulla. (B–D) Quantification of number of unconnected vessels (B), number of branching points per unit area (C) and diameter of CD31+ vessels (D). (E) Representative EM images of peritubular capillaries showing abnormal dilatation, and pericytes containing abnormal vacuoles in mutant kidneys (arrowheads). L, capillary lumen; Pc, pericytes; EC, endothelial cells; Fb, fibroblasts. (F) PAS stained sections showing absent or attenuated mesangium (arrow) in some mutant glomeruli at P0. (G) Quantification of number of glomeruli lacking mesangium. Glomeruli which lacked a mesangium showed a single lumen capillary surrounded by immature podocytes. (N.D., not detected). (H–I) Quantification of glomerular maturity index at P0 (3 > 2 > 1). Mature glomeruli were decreased both in outer (H) and inner cortex (I) in mutant kidneys. (J–K) Images of VSMCs (J; PAS stain, K; αSMA+ expression) in control and mutant kidneys showing a reduction in number of layers of smooth muscle. (L) Quantification of thickness of αSMA+ VSMCs. Bar, 25 μm (A, F, J, K). 2 μm (E). *P < 0.05, **P < 0.01, n = 3–5/group.
Figure 7
Figure 7. Dicer1 inactivation in renal stromal progenitors reduces the maintenance of epithelial progenitors
(A) Images of SIX2 and CITED1 positive cap mesenchyme cells of the developing kidney. Note that mutant stromal cells showed markedly reduction in the expression of these genes both at E15.5 and P0. (B–C) Quantification of number of SIX2+ (B) and CITED1+ (C) cap mesenchyme cells in the nephrogenic zone. Bar, 25 μm. *P < 0.05, **P < 0.01, n = 3/group.
Figure 8
Figure 8. Dicer1 mutation disrupts WNT signaling in renal stromal cells
(A) qPCR data showing changes in the expression of Wnt4, Wnt 11 and regulators of the canonical Wnt signaling, Axin2, Lef1 and Wisp1 in whole kidney. (B–D) Confocal images of LEF1 (B), β-catenin (C) and p57Kip2 (D) in developing renal medulla. Arrowheads indicate interstitial positively stained cells. Note that mutant stromal cells showed marked reduction in the expression of LEF1 and β-catenin accumulation as well as reduction in p57Kip2 at both E15.5 and P0. (E–G) Quantification of number of LEF1+ (E), nuclear β-catenin+ (F) and p57Kip2+ (G) per mm2 of kidney. Bar, 25 μm. **P < 0.01, n = 3–5/group.
Figure 9
Figure 9. Dicer1 mutation results in loss of stromal cell microRNA that serve to promote human renal stromal cell migration, proliferation and expression of factors
(A) Heatmap showing hierarchical cluster analysis of significantly differentially regulated microRNA between control, Foxd1+/GC; Dicer1fl/fl, E15.5 and P0 kidneys. Mutant kidneys cluster together and show 46 miRNA with reduced expression compared with 4 which were increased. When these miRNA were interrogated against miRNA that are enriched in stromal cells 7 miRNA were identified (right panel). (B) Photomicrographs showing effect of anti-miR-214 and -199a-3p on migration. (C) Graph showing the effect of different anti-miRNAs on migration when stimulated by TGFβ after 24h. (D) Graph showing the effect of different anti-miRNAs on proliferation when stimulated by a combination of PDGF-AA and -BB after 16h. (E) Images of phalloidin-Cy3 stained stromal cells showing the formation of lamellipodia and filopodia in response to TGFβ at 24h (arrowheads), a response markedly diminished following silencing of miR-214 or miR-199-3p (F) Graphs showing the effect of anti-miR treatment on transcript levels. Bar, 25 μm. *P < 0.05, **P < 0.01. n = 3–5/group

Comment in

Similar articles

Cited by

References

    1. Levinson RS, Levinson RS, Batourina E, et al. Foxd1-dependent signals control cellularity in the renal capsule, a structure required for normal renal development. Development. 2005;132:529–539. - PubMed
    1. Das A, Tanigawa S, Karner CM, et al. Stromal-epithelial crosstalk regulates kidney progenitor cell differentiation. Nat Cell Biol. 2013;15:1035–1044. - PMC - PubMed
    1. Sims-Lucas S, Schaefer C, Bushnell D, et al. Endothelial Progenitors Exist within the Kidney and Lung Mesenchyme. PLoS ONE. 2013;8:e65993. - PMC - PubMed
    1. Hatini V, Hatini V, Huh SO, et al. Essential role of stromal mesenchyme in kidney morphogenesis revealed by targeted disruption of Winged Helix transcription factor BF-2. Genes Dev. 1996;10:1467–1478. - PubMed
    1. Fetting JL, Fetting JL, Guay JA, et al. FOXD1 promotes nephron progenitor differentiation by repressing decorin in the embryonic kidney. Development. 2014;141:17–27. - PMC - PubMed

Publication types

MeSH terms

LinkOut - more resources