

On the modeling of endocytosis in yeast
- PMID: 25650919
- PMCID: PMC4317554
- DOI: 10.1016/j.bpj.2014.11.3481
On the modeling of endocytosis in yeast
Abstract
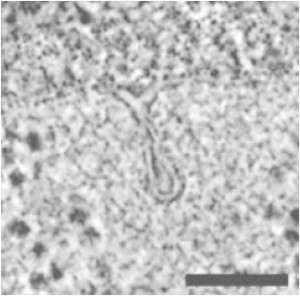
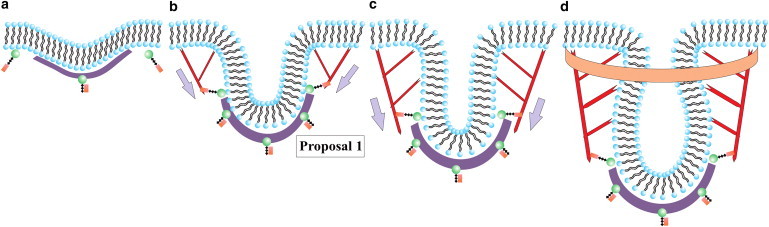
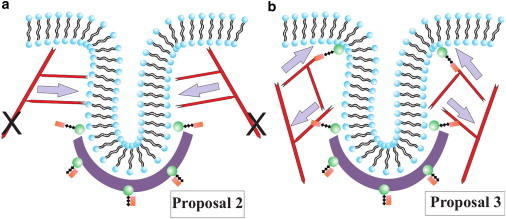
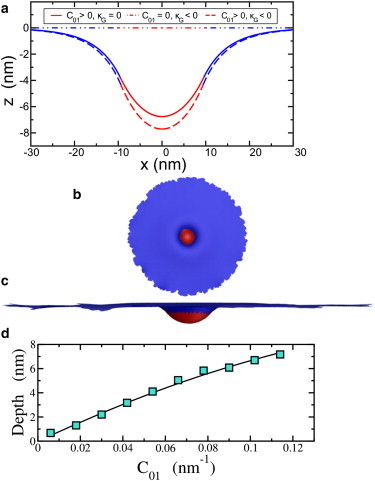
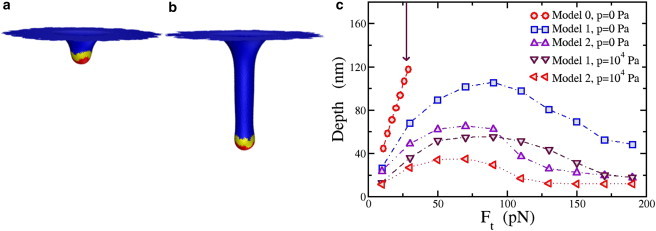
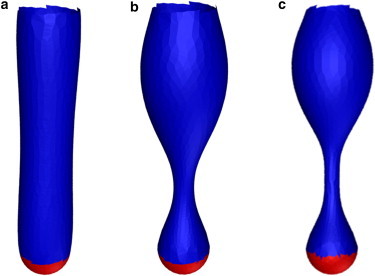
The cell membrane deforms during endocytosis to surround extracellular material and draw it into the cell. Results of experiments on endocytosis in yeast show general agreement that 1) actin polymerizes into a network of filaments exerting active forces on the membrane to deform it, and 2) the large-scale membrane deformation is tubular in shape. In contrast, there are three competing proposals for precisely how the actin filament network organizes itself to drive the deformation. We use variational approaches and numerical simulations to address this competition by analyzing a meso-scale model of actin-mediated endocytosis in yeast. The meso-scale model breaks up the invagination process into three stages: 1) initiation, where clathrin interacts with the membrane via adaptor proteins; 2) elongation, where the membrane is then further deformed by polymerizing actin filaments; and 3) pinch-off. Our results suggest that the pinch-off mechanism may be assisted by a pearling-like instability. We rule out two of the three competing proposals for the organization of the actin filament network during the elongation stage. These two proposals could be important in the pinch-off stage, however, where additional actin polymerization helps break off the vesicle. Implications and comparisons with earlier modeling of endocytosis in yeast are discussed.
Copyright © 2015 Biophysical Society. Published by Elsevier Inc. All rights reserved.
Figures
Similar articles
-
The contributions of the actin machinery to endocytic membrane bending and vesicle formation.Mol Biol Cell. 2018 Jun 1;29(11):1346-1358. doi: 10.1091/mbc.E17-11-0688. Epub 2018 Apr 10. Mol Biol Cell. 2018. PMID: 29851558 Free PMC article.
-
Actin assembly produces sufficient forces for endocytosis in yeast.Mol Biol Cell. 2019 Jul 22;30(16):2014-2024. doi: 10.1091/mbc.E19-01-0059. Epub 2019 Jun 26. Mol Biol Cell. 2019. PMID: 31242058 Free PMC article.
-
Molecular mechanisms of force production in clathrin-mediated endocytosis.FEBS Lett. 2018 Nov;592(21):3586-3605. doi: 10.1002/1873-3468.13192. Epub 2018 Jul 28. FEBS Lett. 2018. PMID: 30006986 Free PMC article. Review.
-
Molecular basis for coupling the plasma membrane to the actin cytoskeleton during clathrin-mediated endocytosis.Proc Natl Acad Sci U S A. 2012 Sep 18;109(38):E2533-42. doi: 10.1073/pnas.1207011109. Epub 2012 Aug 27. Proc Natl Acad Sci U S A. 2012. PMID: 22927393 Free PMC article.
-
The endocytic protein machinery as an actin-driven membrane-remodeling machine.Eur J Cell Biol. 2022 Sep-Nov;101(4):151267. doi: 10.1016/j.ejcb.2022.151267. Epub 2022 Aug 5. Eur J Cell Biol. 2022. PMID: 35970066 Review.
Cited by
-
Modeling membrane reshaping driven by dynamic protein assemblies.Curr Opin Struct Biol. 2023 Feb;78:102505. doi: 10.1016/j.sbi.2022.102505. Epub 2022 Dec 16. Curr Opin Struct Biol. 2023. PMID: 36528994 Free PMC article. Review.
-
Nanoparticle elasticity regulates phagocytosis and cancer cell uptake.Sci Adv. 2020 Apr 17;6(16):eaaz4316. doi: 10.1126/sciadv.aaz4316. eCollection 2020 Apr. Sci Adv. 2020. PMID: 32426455 Free PMC article.
-
Target shape dependence in a simple model of receptor-mediated endocytosis and phagocytosis.Proc Natl Acad Sci U S A. 2016 May 31;113(22):6113-8. doi: 10.1073/pnas.1521974113. Epub 2016 May 16. Proc Natl Acad Sci U S A. 2016. PMID: 27185939 Free PMC article.
-
Local Turgor Pressure Reduction via Channel Clustering.Biophys J. 2016 Dec 20;111(12):2747-2756. doi: 10.1016/j.bpj.2016.10.040. Biophys J. 2016. PMID: 28002750 Free PMC article.
-
A model of actin-driven endocytosis explains differences of endocytic motility in budding and fission yeast.Mol Biol Cell. 2022 Mar 1;33(3):ar16. doi: 10.1091/mbc.E21-07-0362. Epub 2021 Dec 15. Mol Biol Cell. 2022. PMID: 34910589 Free PMC article.
References
-
- Lodish H., Berk A., Matsudaira P. 6th ed. W. H. Freeman; New York: 2007. Molecular Cell Biology.
-
- Kukulski W., Schorb M., Briggs J.A.G. Plasma membrane reshaping during endocytosis is revealed by time-resolved electron tomography. Cell. 2012;150:508–520. - PubMed
-
- McMahon H.T., Boucrot E. Molecular mechanism and physiological functions of clathrin-mediated endocytosis. Nat. Rev. Mol. Cell Biol. 2011;12:517–533. - PubMed
-
- Perrais D., Merrifield C.J. Dynamics of endocytic vesicle creation. Dev. Cell. 2005;9:581–592. - PubMed
Publication types
MeSH terms
Substances
LinkOut - more resources
Full Text Sources
Other Literature Sources
Molecular Biology Databases
