

The Effect of Interference on the CD8(+) T Cell Escape Rates in HIV
- PMID: 25628620
- PMCID: PMC4292734
- DOI: 10.3389/fimmu.2014.00661
The Effect of Interference on the CD8(+) T Cell Escape Rates in HIV
Abstract
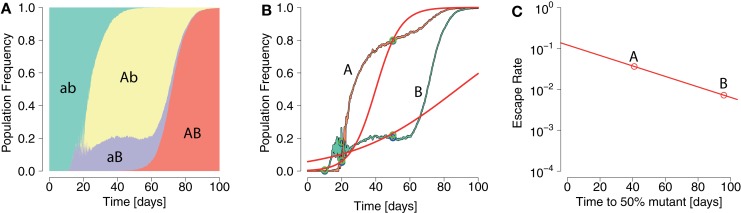
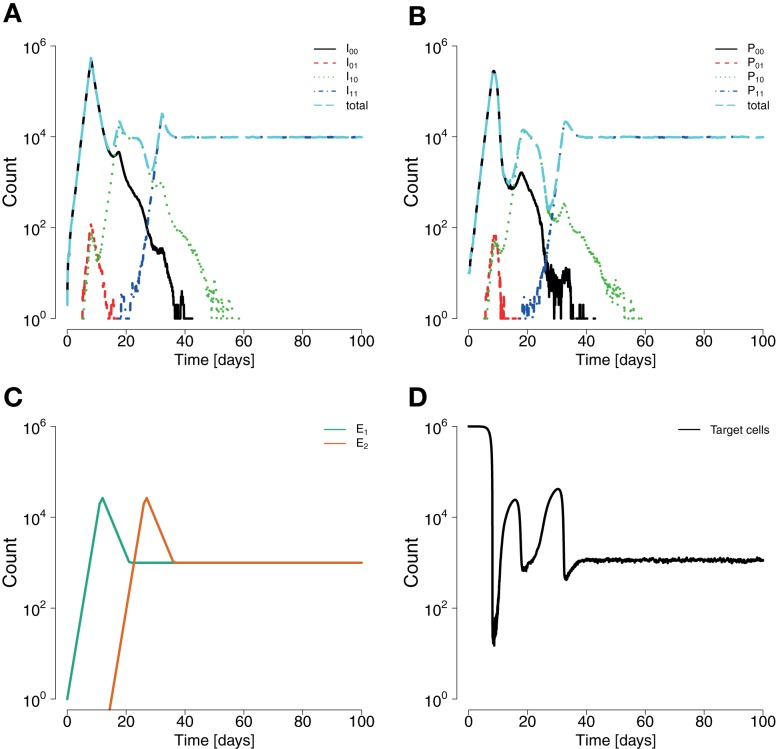
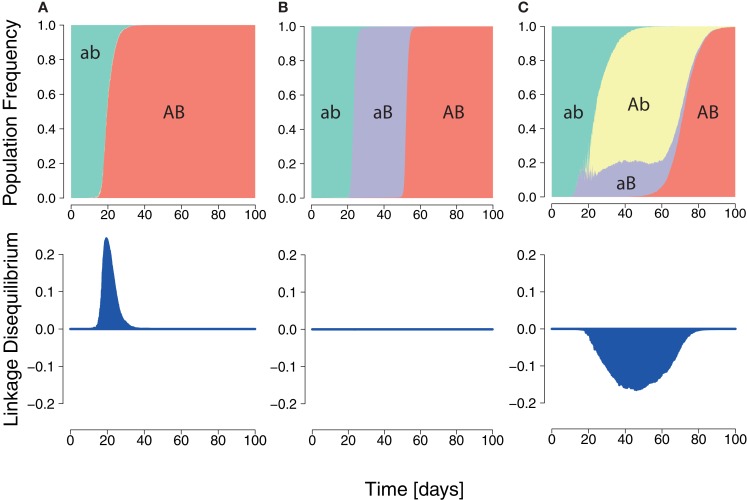
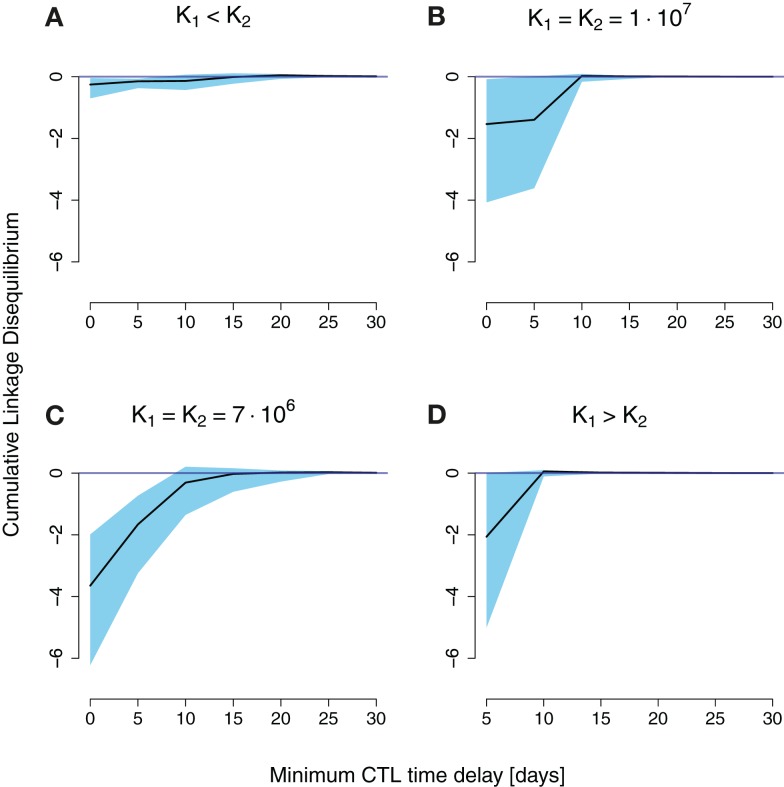
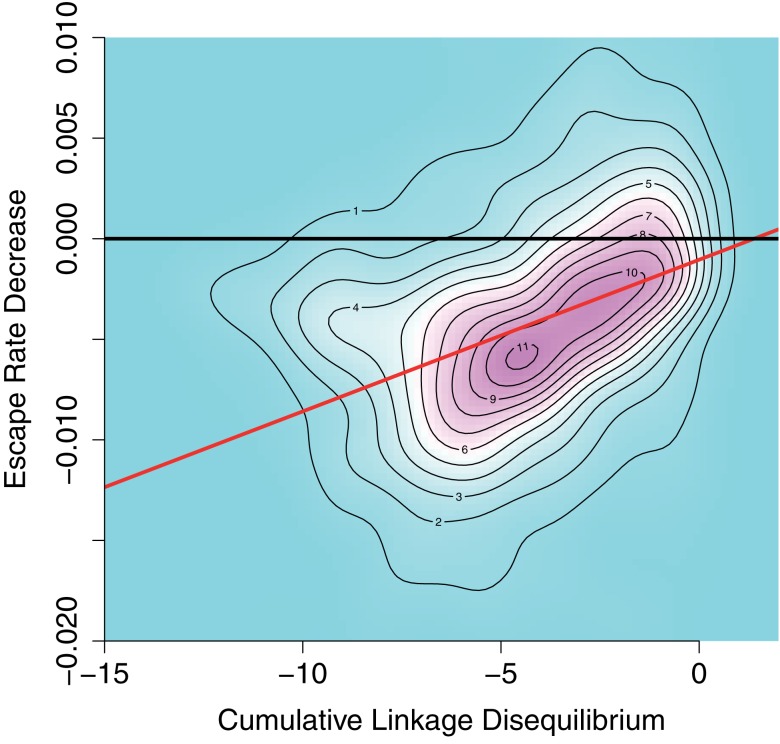
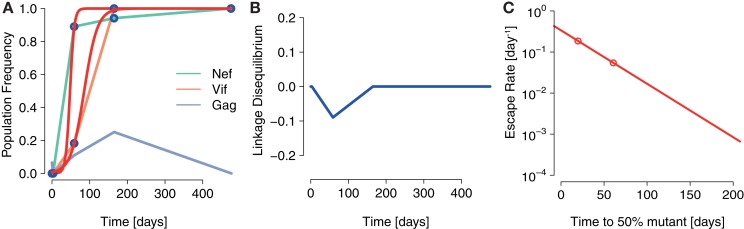
In early human immunodeficiency virus (HIV) infection, the virus population escapes from multiple CD8(+) cell responses. The later an escape mutation emerges, the slower it outgrows its competition, i.e., the escape rate is lower. This pattern could indicate that the strength of the CD8(+) cell responses is waning, or that later viral escape mutants carry a larger fitness cost. In this paper, we investigate whether the pattern of decreasing escape rates could also be caused by genetic interference among different escape strains. To this end, we developed a mathematical multi-epitope model of HIV dynamics, which incorporates stochastic effects, recombination, and mutation. We used cumulative linkage disequilibrium measures to quantify the amount of interference. We found that nearly synchronous, similarly strong immune responses in two-locus systems enhance the generation of genetic interference. This effect, combined with a scheme of densely spaced sampling times at the beginning of infection and sparse sampling times later, leads to decreasing successive escape rate estimates, even when there were no selection differences among alleles. These predictions are supported by empirical data from one HIV-infected patient. Thus, interference could explain why later escapes are slower. Considering escape mutations in isolation, neglecting their genetic linkage, conceals the underlying haplotype dynamics and can affect the estimation of the selective pressure exerted by CD8(+) cells. In systems in which multiple escape mutations appear, the occurrence of interference dynamics should be assessed by measuring the linkage between different escape mutations.
Keywords: HIV dynamics; cytotoxic T lymphocytes; escape; interference; mathematical modeling; theoretical biology.
Figures
Similar articles
-
Investigating the Consequences of Interference between Multiple CD8+ T Cell Escape Mutations in Early HIV Infection.PLoS Comput Biol. 2016 Feb 1;12(2):e1004721. doi: 10.1371/journal.pcbi.1004721. eCollection 2016 Feb. PLoS Comput Biol. 2016. PMID: 26829720 Free PMC article.
-
Within-Epitope Interactions Can Bias CTL Escape Estimation in Early HIV Infection.Front Immunol. 2017 May 1;8:423. doi: 10.3389/fimmu.2017.00423. eCollection 2017. Front Immunol. 2017. PMID: 28507544 Free PMC article.
-
Time Intervals in Sequence Sampling, Not Data Modifications, Have a Major Impact on Estimates of HIV Escape Rates.Viruses. 2018 Feb 27;10(3):99. doi: 10.3390/v10030099. Viruses. 2018. PMID: 29495443 Free PMC article.
-
Epitope-specific CD8+ T cell kinetics rather than viral variability determine the timing of immune escape in simian immunodeficiency virus infection.J Immunol. 2015 May 1;194(9):4112-21. doi: 10.4049/jimmunol.1400793. Epub 2015 Mar 30. J Immunol. 2015. PMID: 25825438
-
Mathematical modeling of escape of HIV from cytotoxic T lymphocyte responses.J Stat Mech. 2013 Jan 1;2013:P01010. doi: 10.1088/1742-5468/2013/01/P01010. J Stat Mech. 2013. PMID: 24660019 Free PMC article.
Cited by
-
A de novo approach to inferring within-host fitness effects during untreated HIV-1 infection.PLoS Pathog. 2020 Jun 3;16(6):e1008171. doi: 10.1371/journal.ppat.1008171. eCollection 2020 Jun. PLoS Pathog. 2020. PMID: 32492061 Free PMC article.
-
Clonal interference can cause wavelet-like oscillations of multilocus linkage disequilibrium.J R Soc Interface. 2018 Mar;15(140):20170921. doi: 10.1098/rsif.2017.0921. J R Soc Interface. 2018. PMID: 29563246 Free PMC article.
-
Investigating the Consequences of Interference between Multiple CD8+ T Cell Escape Mutations in Early HIV Infection.PLoS Comput Biol. 2016 Feb 1;12(2):e1004721. doi: 10.1371/journal.pcbi.1004721. eCollection 2016 Feb. PLoS Comput Biol. 2016. PMID: 26829720 Free PMC article.
-
Modeling the immune response to HIV infection.Curr Opin Syst Biol. 2018 Dec;12:61-69. doi: 10.1016/j.coisb.2018.10.006. Epub 2018 Nov 8. Curr Opin Syst Biol. 2018. PMID: 31463420 Free PMC article.
-
Cancer-induced immunosuppression can enable effectiveness of immunotherapy through bistability generation: A mathematical and computational examination.J Theor Biol. 2020 May 7;492:110185. doi: 10.1016/j.jtbi.2020.110185. Epub 2020 Feb 6. J Theor Biol. 2020. PMID: 32035826 Free PMC article.
References
LinkOut - more resources
Full Text Sources
Other Literature Sources
Research Materials