. 2015 Feb 10;112(6):E546-55.
doi: 10.1073/pnas.1416276112. Epub 2015 Jan 26.

Functional capacities of human IgM memory B cells in early inflammatory responses and secondary germinal center reactions

Affiliations

Functional capacities of human IgM memory B cells in early inflammatory responses and secondary germinal center reactions

Marc Seifert et al. Proc Natl Acad Sci U S A. .

Abstract

The generation and functions of human peripheral blood (PB) IgM(+)IgD(+)CD27(+) B lymphocytes with somatically mutated IgV genes are controversially discussed. We determined their differential gene expression to naive B cells and to IgM-only and IgG(+) memory B cells. This analysis revealed a high similarity of IgM(+)(IgD(+))CD27(+) and IgG(+) memory B cells but also pointed at distinct functional capacities of both subsets. In vitro analyses revealed a tendency of activated IgM(+)IgD(+)CD27(+) B cells to migrate to B-cell follicles and undergo germinal center (GC) B-cell differentiation, whereas activated IgG(+) memory B cells preferentially showed a plasma cell (PC) fate. This observation was supported by reverse regulation of B-cell lymphoma 6 and PR domain containing 1 and differential BTB and CNC homology 1, basic leucine zipper transcription factor 2 expression. Moreover, IgM(+)IgD(+)CD27(+) B lymphocytes preferentially responded to neutrophil-derived cytokines. Costimulation with catecholamines, carcinoembryonic antigen cell adhesion molecule 8 (CEACAM8), and IFN-γ caused differentiation of IgM(+)IgD(+)CD27(+) B cells into PCs, induced class switching to IgG2, and was reproducible in cocultures with neutrophils. In conclusion, this study substantiates memory B-cell characteristics of human IgM(+)IgD(+)CD27(+) B cells in that they share typical memory B-cell transcription patterns with IgG(+) post-GC B cells and show a faster and more vigorous restimulation potential, a hallmark of immune memory. Moreover, this work reveals a functional plasticity of human IgM memory B cells by showing their propensity to undergo secondary GC reactions upon reactivation, but also by their special role in early inflammation via interaction with immunomodulatory neutrophils.

Keywords: IgM memory B-cell functions; early inflammatory response; germinal center reentry.


Conflict of interest statement

The authors declare no conflict of interest.

Figures

Fig. 1.
Fig. 1.
Transcriptional similarity of human PB B-cell subsets. (A) Dendrogram is calculated by Manhattan clustering of 4,717 probe sets with the highest SDs. Subcluster stability was confirmed by a bootstrapping procedure (>70%). The color bar depicts normalized intensity values. The color boxes at the bottom of the dendrogram depict the B-cell subsets: green, IgM+IgD+CD27+ B cells; blue, IgM-only B cells; yellow, IgG+CD27+ B cells; red, naive B cells. (B) Unsupervised PCA shows a high similarity of PB IgM+IgD+CD27+, IgM-only, and class-switched B cells, but not naive B cells. The PCA is based on 29,969 probe sets with the highest SDs, explaining more than 43% of total variance. Axis scaling is according to mean centering and scaling. The color code is as in A.
Fig. 2.
Fig. 2.
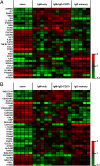
Transcriptional patterns in human PB B-cell subsets. (A) Expression heat map of normalized signal intensities from statistically significant (ANOVA, P < 0.05; Tukey post hoc, P < 0.05) differentially expressed cytokines, hormones, growth factors, and their receptors in naive, IgG+CD27+, IgM+IgD+CD27+, and IgM-only B cells. (B) Expression heat map of normalized signal intensities from statistically significant differentially expressed cell adhesion molecules in naive, IgG+CD27+, IgM+IgD+CD27+, and IgM-only B cells.
Fig. 3.
Fig. 3.
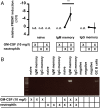
ADRB2 is a costimulator of human IgM memory B cells. (A) FACS analysis of CD19-enriched human PB B-lymphocyte subsets, defined by IgD, IgG, and CD27 expression. ADRB2 surface expression of B-cell subsets from five healthy subjects is depicted as the mean fluorescence intensity (MFI), normalized to an isotype control. Lines between the values link the samples derived from a given donor. (B) Representative FACS histogram of ADRB2 expression on naive (light gray), IgG memory (dark gray), and IgM memory (black line) B cells and an isotype control (dashed line). (C) Frequency of B-cell subsets in the G2/S phase of the cell cycle, as determined by propidium iodide (PI) staining, after BCR stimulation and treatment with 10−5 M terbutaline (normalized to BCR stimulation alone) for three blood donors. Cells were stimulated for 16 h. (D) One representative ELISpot analysis out of three experiments with sort-purified B-cell subsets, stimulated with combinations of 10−5 M terbutaline, 10 mg/L anti-Ig antibody, and 10−3 M nadolol or anti-Ig antibody alone. Numbers in the lower left corners give the total number of spots counted by the ELISpot reader. (E) Overview of ELISpot analyses of ADRB2-stimulated B-cell subsets as in D: blue, 10−5 M terbutaline and 10 mg/L anti-Ig antibody; black, 10−3 M terbutaline alone; red, 10−5 M terbutaline, 10 mg/L anti-Ig antibody, and 10−3 M nadolol. Shown are the number of spots per well after subtraction of anti-Ig stimulation alone. (A, C, and E) *P < 0.05; ***P < 0.001, significance values in E refer to blue data points.
Fig. 4.
Fig. 4.
Analysis of CCR2, CEACAM1, and IFNGR1 expression and function on PB naive and memory B cells. (A) CCR2 surface expression of B cells from five healthy subjects is depicted as MFI, normalized to isotype control. (B) Representative FACS histogram of CCR2 expression on naive (light gray), IgG memory (dark gray), and IgM memory B (black line) cells and isotype control (dashed line). max, maximum. (C) Surface CEACAM1 expression as in A. (D) Representative CEACAM1 expression histogram; B-cell populations are depicted as in B. (E and F) Relative numbers of sort-purified B-cell subsets that migrated toward MCP1 (175 IU) and sCEACAM8 (100 mg/L), respectively. (G and H) Mean migration factors (migrated cells in stimulation divided by unstimulated migrated cells) of sort-purified B-cell subsets toward 50, 100, and 175 IU of MCP1 and 50, 100, and 175 mg/L sCEACAM8, respectively. Error bars depict SD of five donors analyzed. (I) Representative ELISpot analysis out of three experiments with sorted B-cell subsets, stimulated with 100 mg/L sCEACAM8 and 10 mg/L anti-Ig antibody or 10 mg/L anti-CEACAM8 and 10 mg/L anti-Ig antibody. Numbers in the lower left corners give the total number of spots counted. (J) Overview of ELISpot analyses of CEACAM8-stimulated B-cell subsets: blue, 100 mg/L CEACAM8 and 10 mg/L anti-Ig antibody; black, 100 mg/L CEACAM8 alone; red, 10 mg/L anti-CEACAM1 and 10 mg/L anti-Ig antibody. Shown are the number of spots per well after subtraction of anti-Ig stimulation alone. Significance values refer to blue data points. (K) Representative IFNGR1 expression histogram; populations are depicted as in B. (L) FACS histogram of IgG2 expression on IgM memory B cells activated for 6 days with 1 mg/L each of anti-Ig antibody, PWM, and BAFF alone (dark gray) or with 1 mg/L IFN-γ in addition (black line). The isotype control is shown as a dashed line. Data are representative of four independent donors (*P < 0.05; **P < 0.01; ***P < 0.001).
Fig. 5.
Fig. 5.
Human IgM memory B cells differentiate into PCs upon interaction with activated neutrophils. (A) Coculture of human PB B-cell subsets with GM-CSF–activated neutrophils induces PRDM1 transcription in IgM memory B cells, compared with coculture conditions excluding GM-CSF. The cycle threshold (ΔCt) of PRDM1 vs. GAPDH is shown (i.e., negative values indicate increased PRDM1 expression). GM-CSF treatment alone does not induce PRDM1 transcription in B lymphocytes. n.d., not detectable (**P < 0.01). (B) Cγ2 switch transcript induction is detectable in IgM memory B cells cocultured with GM-CSF–activated neutrophils. One representative analysis of three is shown.
Fig. 6.
Fig. 6.
Follicle homing capacity of human IgM memory B cells. Relative number of B cells per sort-purified subset that migrated toward 175 IU of B-cell follicle (border) homing chemokines CXCL13 (A), CCL21 (B), and CCL19 (C), to which IgM memory B cells show the highest migration capacity, and PC site homing cytokine CXCL12 (D), where naive or class-switched memory B cells respond more intensively. (E) Dose dependency of follicle homing cytokines CXCL13, CCL21, and CCL19 on purified B-cell subsets. Significantly (P < 0.05) enhanced migration of IgM memory B cells is marked by black bars. “PC induction” marks assays, where the B cells were treated with mitogens (R848 and PWM) before the migration assay to induce PC development, blocking follicle homing potential. Due to the milder CCL19-dependent chemotaxis, only two donors were analyzed; an effect of plasmablast differentiation was detectable in one donor. n.s., not significant. (F) Dose dependency of PC site homing cytokine CXCL12. PC differentiation induces a PC site homing potential in IgM memory B cells. (G) Representative FACS histogram of JAM-C surface expression on naive (light gray), IgG memory (dark gray), and IgM memory (black line) B cells and an isotype control (dashed line). Similar results were obtained for a total of five donors tested. *P < 0.05; **P < 0.01.
Fig. 7.
Fig. 7.
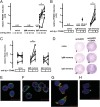
GC B-cell differentiation capacity of human IgM memory B cells. (AC) Relative induction of transcripts, measured by QRT-PCR and normalized to GAPDH, associated with PC or GC B-cell differentiation in sorted PB B-cell subsets upon in vitro anti-Ig antibody treatment (TI stimulation) or in combination with CD40L (TD-like stimulation) costimulation. **P < 0.01; n.d.: not detected. TI (A) and TD (B) stimulation induced PRDM1 transcription in IgG memory B cells, but only in one-quarter of IgM memory B cells and to no detectable amount in naive B cells. (C) However, TD stimulation significantly up-regulated BCL6 in IgM memory B cells, but not in IgG memory B cells and not detectably in naive B cells. (D) Representative ELISpot analysis out of three experiments with sort-purified B-cell subsets, stimulated with 1 mg/L anti-Ig antibody, 2 mg/L recombinant human CD40-HA, and 1 mg/L anti-HA (TD) and anti-Ig antibody alone (TI). Numbers in the lower left corners give the total number of spots counted by the ELISpot reader. BACH2 fluorescence microscopy before and after 16 h of anti-Ig treatment of naive (E), IgM memory (F), and IgG memory (G) B cells is shown. Although BACH2 nuclear export was detectable in ca. 50% of IgM memory B cells, it occurred more efficiently in IgG memory B cells upon stimulation (G), showing cytosolic BACH2 degradation at the PC differentiation stage (H). Data are representative of three donors tested. Green, BACH2; blue, DAPI; red, phalloidin. (Scale bars: 10 μm.) (Also Fig. S6 BI and Table S2.)

Comment in

  • B cell memory: Making sense in humans.
    Kugelberg E. Kugelberg E. Nat Rev Immunol. 2015 Mar;15(3):133. doi: 10.1038/nri3822. Epub 2015 Feb 6. Nat Rev Immunol. 2015. PMID: 25656708 No abstract available.

Similar articles

Cited by

References

    1. Okada T, Cyster JG. B cell migration and interactions in the early phase of antibody responses. Curr Opin Immunol. 2006;18(3):278–285. - PubMed
    1. Lee SK, et al. B cell priming for extrafollicular antibody responses requires Bcl-6 expression by T cells. J Exp Med. 2011;208(7):1377–1388. - PMC - PubMed
    1. Gatto D, Brink R. B cell localization: Regulation by EBI2 and its oxysterol ligand. Trends Immunol. 2013;34(7):336–341. - PubMed
    1. MacLennan IC. Germinal centers. Annu Rev Immunol. 1994;12:117–139. - PubMed
    1. Tarlinton D, Good-Jacobson K. Diversity among memory B cells: Origin, consequences, and utility. Science. 2013;341(6151):1205–1211. - PubMed

Publication types

MeSH terms

Substances

Associated data