Early cytokine and antibody responses against Coxiella burnetii in aerosol infection of BALB/c mice
- PMID: 25618420
- PMCID: PMC4740919
- DOI: 10.1016/j.diagmicrobio.2014.12.008
Early cytokine and antibody responses against Coxiella burnetii in aerosol infection of BALB/c mice
Abstract
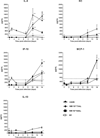
Coxiella burnetii, a Gram-negative intracellular bacterium, can give rise to Q fever in humans and is transmitted mainly by inhalation of infected aerosols from animal reservoirs. Serology is commonly used to diagnose Q fever, but the early cellular immune response-i.e., C. burnetii-specific interferon γ (IFN-γ) production in response to antigen challenge-might be an additional diagnostic. Detection of IFN-γ responses has been used to identify past and chronic Q fever infections, but the IFN-γ response in acute Q fever has not been described. By challenging immunocompetent BALB/c mice with aerosols containing phase I C. burnetii, the timing and extent of IFN-γ recall responses were evaluated in an acute C. burnetii infection. Other cytokines were also measured in an effort to identify other potential diagnostic markers. The data show that after initial expansion of bacteria first in lungs and then in other tissues, the infection was cleared from day 10 onwards as reflected by the decreasing number of bacteria. The antigen-induced IFN-γ production by splenocytes coincided with emergence of IgM phase II antibodies at day 10 postinfection and preceded appearance of IgG antibodies. This was accompanied by the production of proinflammatory cytokines including interleukin (IL) 6, keratinocyte-derived cytokine, and IFN-γ-induced protein 10, followed by monocyte chemotactic protein 1, but not by IL-1β and tumor necrosis factor α, and only very low production of the anti-inflammatory cytokine IL-10. These data suggest that analysis of antigen-specific IFN-γ responses could be a useful tool for diagnosis of acute Q fever. Moreover, the current model of C. burnetii infection could be used to give new insights into immunological factors that predispose to development of persistent infection.
Keywords: Cellular immunity; Coxiella burnetii; Cytokines; Interferon-gamma; Q fever; Serology.
Published by Elsevier Inc.
Conflict of interest statement
A patent application has been submitted by MGN, MVD and LABJ for a C. burnetii–specific IFN-γ production assay to diagnose Q fever and is registered by the number PCT/NL 2011/050564.
Figures


Similar articles
-
A combination of interferon-gamma and interleukin-2 production by Coxiella burnetii-stimulated circulating cells discriminates between chronic Q fever and past Q fever.Clin Microbiol Infect. 2014 Jul;20(7):642-50. doi: 10.1111/1469-0691.12423. Epub 2013 Nov 18. Clin Microbiol Infect. 2014. PMID: 24118683
-
Viable Coxiella burnetii Induces Differential Cytokine Responses in Chronic Q Fever Patients Compared to Heat-Killed Coxiella burnetii.Infect Immun. 2018 Sep 21;86(10):e00333-18. doi: 10.1128/IAI.00333-18. Print 2018 Oct. Infect Immun. 2018. PMID: 30037794 Free PMC article.
-
Intact interferon-γ response against Coxiella burnetii by peripheral blood mononuclear cells in chronic Q fever.Clin Microbiol Infect. 2017 Mar;23(3):209.e9-209.e15. doi: 10.1016/j.cmi.2016.11.008. Epub 2016 Nov 20. Clin Microbiol Infect. 2017. PMID: 27876593
-
Role of innate and adaptive immunity in the control of Q fever.Adv Exp Med Biol. 2012;984:273-86. doi: 10.1007/978-94-007-4315-1_14. Adv Exp Med Biol. 2012. PMID: 22711637 Review.
-
Q fever: persistence of antigenic non-viable cell residues of Coxiella burnetii in the host--implications for post Q fever infection fatigue syndrome and other chronic sequelae.QJM. 2009 Oct;102(10):673-84. doi: 10.1093/qjmed/hcp077. Epub 2009 Jun 25. QJM. 2009. PMID: 19556396 Review.
Cited by
-
Transmission of Coxiella burnetii by ingestion in mice.Epidemiol Infect. 2020 Feb 5;148:e21. doi: 10.1017/S0950268820000059. Epidemiol Infect. 2020. PMID: 32019625 Free PMC article.
-
Coxiella burnetii infections in mice: Immunological responses to contemporary genotypes found in the US.Virulence. 2021 Dec;12(1):2461-2473. doi: 10.1080/21505594.2021.1975527. Virulence. 2021. PMID: 34516359 Free PMC article.
-
Longitudinal surveillance of Coxiella burnetii following an abortion storm in domestic goats.Front Vet Sci. 2024 Sep 13;11:1426573. doi: 10.3389/fvets.2024.1426573. eCollection 2024. Front Vet Sci. 2024. PMID: 39346957 Free PMC article.
-
Early Cytokine Response After Vaccination with Coxiella Burnetii Phase I in an Infected Herd of Dairy Cattle.J Vet Res. 2018 Dec 31;62(4):469-476. doi: 10.2478/jvetres-2018-0076. eCollection 2018 Dec. J Vet Res. 2018. PMID: 30729204 Free PMC article.
-
Murine Alveolar Macrophages Are Highly Susceptible to Replication of Coxiella burnetii Phase II In Vitro.Infect Immun. 2016 Aug 19;84(9):2439-48. doi: 10.1128/IAI.00411-16. Print 2016 Sep. Infect Immun. 2016. PMID: 27297388 Free PMC article.
References
-
- McQuiston JH, Childs JE. Q fever in humans and animals in the United States. Vector Borne Zoonotic Dis. 2002;2(3):179–191. - PubMed
-
- Parker NR, Barralet JH, Bell AM. Q fever. Lancet. 2006;367(9511):679–688. - PubMed
-
- Benenson AS, Tigertt WD. Studies on Q fever in man. Trans Assoc Am Physicians. 1956;69:98–104. - PubMed
-
- Million M, Thuny F, Richet H, Raoult D. Long-term outcome of Q fever endocarditis: a 26-year personal survey. Lancet Infect Dis. 2010;10(8):527–535. - PubMed
-
- Million M, Walter G, Thuny F, Habib G, Raoult D. Evolution from acute Q fever to endocarditis is associated with underlying valvulopathy and age and can be prevented by prolonged antibiotic treatment. Clin Infect Dis. 2013;57(6):836–844. - PubMed
Publication types
MeSH terms
Substances
Grants and funding
LinkOut - more resources
Full Text Sources
Other Literature Sources
Research Materials
Miscellaneous

