. 2015 Apr;35(4):817-28.
doi: 10.1161/ATVBAHA.114.305218. Epub 2015 Jan 22.

Myocardin regulates vascular smooth muscle cell inflammatory activation and disease

Affiliations

Myocardin regulates vascular smooth muscle cell inflammatory activation and disease

Matthew Ackers-Johnson et al. Arterioscler Thromb Vasc Biol. 2015 Apr.

Abstract

Objective: Atherosclerosis, the cause of 50% of deaths in westernized societies, is widely regarded as a chronic vascular inflammatory disease. Vascular smooth muscle cell (VSMC) inflammatory activation in response to local proinflammatory stimuli contributes to disease progression and is a pervasive feature in developing atherosclerotic plaques. Therefore, it is of considerable therapeutic importance to identify mechanisms that regulate the VSMC inflammatory response.

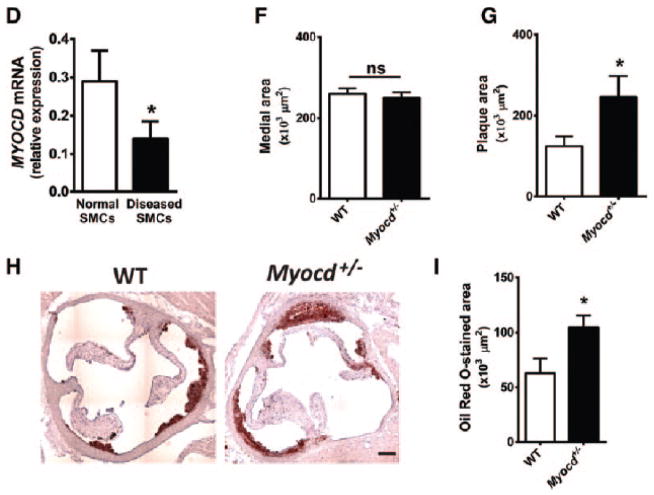
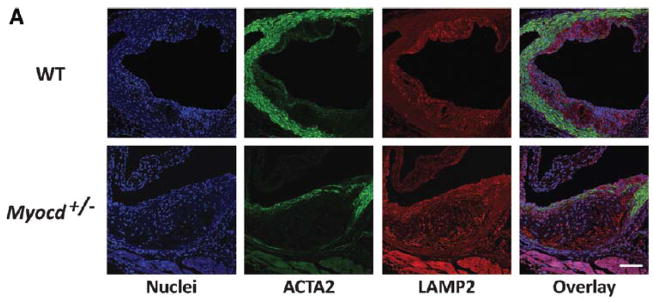
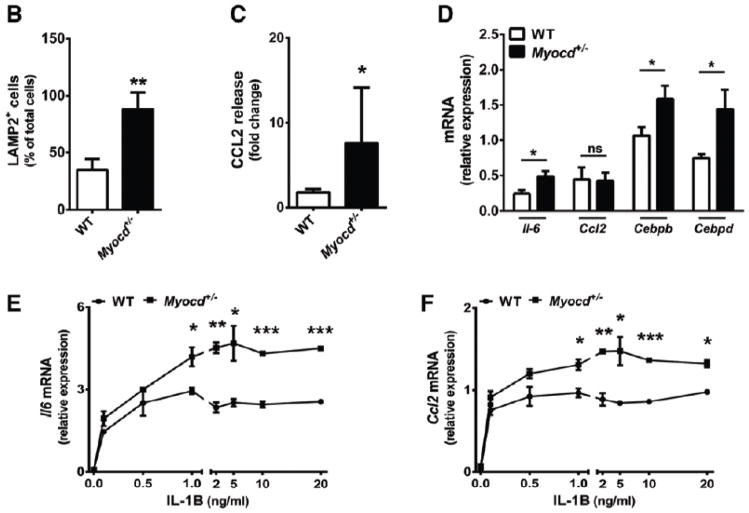
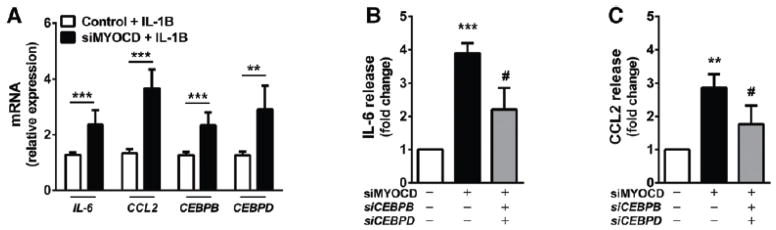
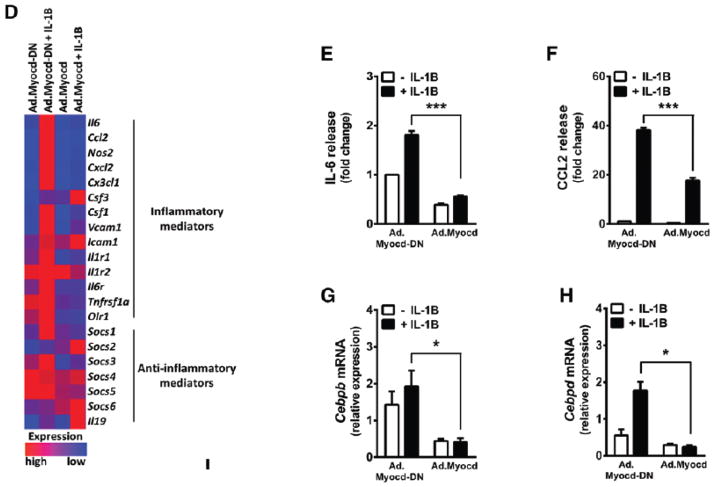
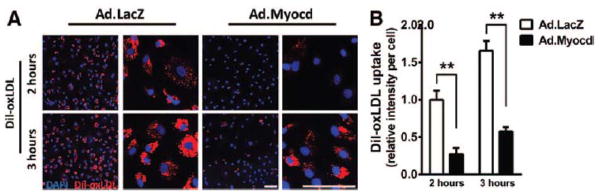
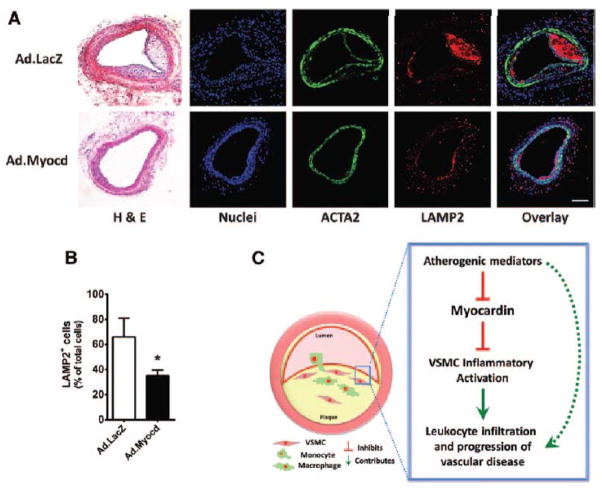
Approach and results: We report that myocardin, a powerful myogenic transcriptional coactivator, negatively regulates VSMC inflammatory activation and vascular disease. Myocardin levels are reduced during atherosclerosis, in association with phenotypic switching of smooth muscle cells. Myocardin deficiency accelerates atherogenesis in hypercholesterolemic apolipoprotein E(-/-) mice. Conversely, increased myocardin expression potently abrogates the induction of an array of inflammatory cytokines, chemokines, and adhesion molecules in VSMCs. Expression of myocardin in VSMCs reduces lipid uptake, macrophage interaction, chemotaxis, and macrophage-endothelial tethering in vitro, and attenuates monocyte accumulation within developing lesions in vivo. These results demonstrate that endogenous levels of myocardin are a critical regulator of vessel inflammation.

Conclusions: We propose myocardin as a guardian of the contractile, noninflammatory VSMC phenotype, with loss of myocardin representing a critical permissive step in the process of phenotypic transition and inflammatory activation, at the onset of vascular disease.

Keywords: atherosclerosis; inflammation; myocardin; smooth muscle.


Figures

Figure 1
Figure 1. Loss of myocardin accelerates early atherosclerotic lesion development in a murine model of high-fat diet
(A–B) Quantification of myocardin (A) and smooth muscle markers, smooth muscle α-actin (Acta2) and smooth muscle myosin heavy chain (Myh11; B) mRNA expression in collar-induced atherosclerosis in carotid arteries of ApoE−/− mice (n=3). (C–D) Myocardin mRNA expression in normal human aorta and diseased carotid vessels (C; n=3) and in SMCs derived from human aorta and diseased carotid plaques (D; n=3). (E) Hematoxylin and eosin staining of aortic root sections from ApoE−/−.Myocd+/+ (wild type, WT) and ApoE−/−.Myocd+/− (Myocd+/−) mice fed on high-fat diet for 8 weeks. Scale bar, 250 μm. (F–G) Quantification of aortic root medial (F) and plaque area (G) from WT (n=15) and Myocd+/− (n=11) mice fed on high-fat diet. (H) Oil red O staining of aortic root sections from WT and Myocd+/− mice fed on high-fat diet for 8 weeks. Scale bar, 250 μm. (I) Quantification of lipid rich regions by oil red O staining in the aortic root in WT (n=5) and Myocd+/− (n=6). Data are presented as mean±s.e.m. *P<0.05 Student’s t-test. ns indicates no statistical significance.
Figure 2
Figure 2. Myocardin haploinsufficiency potentiates infiltration of macrophages and inflammation during atherosclerotic lesion development
(A) Confocal images of aortic root from high-fat fed ApoE−/− .Myocd+/+ (wild type, WT) and ApoE−/−. Myocd+/− (Myocd+/−) mice labelled with antibodies directed against smooth muscle α-actin (ACTA2; green) and lysosome-associated membrane protein 2 (LAMP2; red). 4′,6-diamidino-2-phenylindole (DAPI; blue) counterstaining indicates nuclei. Scale bar, 100 μm. (B) Quantification of macrophages (cells positive for LAMP2) in the plaque regions of the aortic root from WT (n=5) and Myocd+/− (n=5) mice fed on high-fat diet for 8 weeks. (C) Levels of serum monocyte chemotactic protein-1 (CCL2) in WT and Myocd+/− mice fed on high-fat diet for 4 weeks. Data are presented as a mean fold change relative to week 0. (D) Expression of inflammatory marker mRNA in mouse aortic root, after 1 week high fat diet. (E–H) mRNA expression of interleukin-6 (Il-6; E), Ccl2 (F), Cebpb (G) and Cebpd (H) in VSMCs derived from WT and Myocd+/− aortas after 4 hr stimulation with interleukin-1beta (IL-1B; n=3). Data are presented as mean±s.e.m. *P<0.05, ** P<0.01 and ***P<0.001 Student’s t-test.
Figure 3
Figure 3. Myocardin antagonises interleukin-1beta-induced inflammatory pathways in vascular smooth muscle cells
(A) Expression of inflammatory marker mRNA in human coronary SMC (HCASMC) transfected with scrambled control siRNA or siRNA against myocardin (siMYOCD) for 24 hr, before treatment with 20 ng/ml interleukin-1beta (IL-1B). (B–C) Release of interleukin-6 (IL-6; B) and monocyte chemotactic protein-1 (CCL2; C) from HCASMCs transfected with scrambled control siRNA or siRNA against myocardin (siMYOCD), CEBPB (siCEBPB) and CEBPD (siCEBPD), as indicated, for 24 hr, before treatment with 20 ng/ml interleukin-1beta (IL-1B). IL-6 and CCL-2 release into surrounding media was quantified by enzyme-linked immunosorbent assay (ELISA). Data are presented as mean±s.e.m. n=3 independent experiments in biological triplicate. **P<0.01 and ***P<0.001 compared to scrambled siRNA-only control; #P<0.05 compared to siMYOCD-only treated cells. Rat aortic VSMCs were then transduced with adenoviral vectors (Ad) expressing dominant negative myocardin (Ad.Myocd-DN) control, or myocardin (Ad.Myocd). (D) mRNA expression of inflammatory and anti-inflammatory genes determined by real time quantitative PCR and presented in a heat map format, for VSMCs treated with Ad.Myocd-DN control or Ad.Myocd and stimulated for 4 hr with 20 ng/ml IL-1B. Red (high) and blue (low) depict differential gene expression relative to mean expression across all treatments. Source data are available for this figure (Supplementary Fig 1). (E–F) Quantification of IL-6 (E) and CCL2 (F) release after 24 hr IL-1B stimulation. (G-H) Cebpb (G) and Cebpd (H) mRNA expression in rat VSMCs treated with Ad.Myocd-DN control or Ad.Myocd and stimulated for 4 hr with 20 ng/ml IL-1B. Expression of CEBPB and CEBPD in rat VSMCs treated with Ad.LacZ or Ad.Myocd followed by IL-1B stimulation (I). Analysis of Il6 and Ccl2 gene promoters by chromatin immunoprecipitation (ChIP) (J). VSMCs overexpressing Myocd or Myocd-DN constructs were stimulated for 4 hours with IL-1B. Cellular lysates were incubated with anti-CEBPB antibody or IgG antibody (control). Bound Il6 and Ccl2 promoter DNA was then quantified by real-time PCR. Data are presented as mean±s.e.m, n=3 independent experiments in biological triplicate. *P<0.05, ** P<0.01 and ***P<0.001 Student’s t-test. ns indicates no statistical significance.
Figure 4
Figure 4. Myocardin reduces the uptake of oxidised lipoproteins
Human coronary smooth muscle cells (HCASMCs) were transduced with adenoviral vectors (Ad) expressing beta-galactosidase (Ad.LacZ; control) or myocardin (Ad.Myocd) then incubated with Dil-ox-LDL (10 mg/ml) for indicated time intervals. (A) Effect of myocardin on the uptake of fluorescent-labelled oxidised lipoprotein (Dil-ox-LDL; red). 4′,6-diamidino-2-phenylindole (DAPI; blue) counterstaining incidates nuclei. Scale bar, 100 μm. (B) Quantification of accumulated Dil-oxLDL in HCASMCs. Data are presented as mean±s.e.m. ** P<0.01 Student’s t-test.
Figure 5
Figure 5. Myocardin expression in VSMC reduces macrophage chemotaxis, adhesion and uptake of lipids
(A) Myocardin expression in vascular smooth muscle cells (VSMC) reduces macrophage chemotaxis. Rat VSMCs were transduced with adenoviral vectors (Ad) expressing either dominant negative myocardin (Ad.Myocd-DN) control or myocardin (Ad.Myocd) and pre-stimulated for 6 hr with 20 ng/ml interleukin-1beta (IL-1B). Fluorescent-labelled RAW264.7 macrophages were applied to upper chambers of coated transwell inserts. After 20 hr incubation, un-migrated macrophages on the upper trans-well surface were removed and remaining migrated macrophages were quantified. Quantification of fluorescent-labelled macrophages was performed using fluorescence microscopy and image analysis with ImageJ software. Data are presented as mean±s.e.m., n=3 independent experiments in biological triplicate. *P<0.05 and ** P<0.01 Student’s t-test. (B) Myocardin expression in VSMC reduces macrophage adhesion. Confluent VSMC monolayers were treated with Ad.Myocd-DN control or Ad.Myocd and pre-stimulated for 24 hr with 20 ng/ml IL-1B. VSMC monolayers were incubated for 45 min with fluorescent-labelled RAW264.7 macrophages, before washing and quantification of adhered macrophages, as above. (C) Ad.Myocd-treated VSMCs induce diminished endothelial-macrophage cell interaction. Conditioned media was collected from Ad.Myocd-DN (control) or Ad.Myocd transduced, unstimulated or IL-1B stimulated VSMCs. Human umbilical vein endothelial cell (HUVEC) monolayers were maintained in the conditioned media for 24 hr. The HUVEC monolayers were then incubated for 45 min with fluorescent-labelled RAW264.7 macrophages, before washing and quantification of adhered macrophages, as above. (D) VSMCs transduced with Ad.Myocd reduce the uptake of acetylated low-density lipoprotein (Ac-LDL) by macrophages. Conditioned media was collected from Ad.Myocd-DN (control) or Ad.Myocd transduced, unstimulated or IL-1B stimulated VSMCs. RAW264.7 macrophages were maintained in the conditioned media for 16 hr. The macrophages were then incubated for 3 hours with Dil-labelled Ac-LDL (Dil-Ac-LDL; red). Scale bar, 100 μm. (E) Quantification of Dil-Ac-LDL accumulation in RAW264.7 macrophages. Data are presented as mean±s.e.m., n=3 independent experiments in biological triplicate. *P<0.05, ** P<0.01 and ***P<0.001 Student’s t-test.
Figure 6
Figure 6. Myocardin inhibits accumulation of macrophages in the neointima
(A) Hematoxylin and eosin (H&E) and confocal images of carotid arteries from mice transduced with adenoviral vectors expressing beta-galactosidase (Ad.LacZ) control or Ad.Myocd. Carotid sections were labelled with antibodies directed against smooth muscle α-actin (ACTA2; green) and lysosome-associated membrane protein 2 (LAMP2; red). 4′,6-diamidino-2-phenylindole (DAPI; blue) counterstaining indicates nuclei. Scale bar, 100 μm. (B) Quantification of macrophages (cells positive for LAMP2) in the neointimal layers. Data are presented as mean±s.e.m. *P<0.05 Student’s t-test. Ad.LacZ (n=12) and Ad.Myocd (n=13). (C) Schematic illustrating a proposed model whereby reduced myocardin expression in contractile medial vascular smooth muscle cells (VSMCs) is a necessary permissive step in VSMC inflammatory activation following exposure to atherogenic stimuli, leading to increased leukocyte infiltration and progression of atherosclerosis. Dashed arrow represents VSMC-independent routes of disease progression.

Similar articles

Cited by

References

    1. Dahlöf B. Cardiovascular disease risk factors: epidemiology and risk assessment. Am J Cardiol. 2010;105:3A–9A. - PubMed
    1. Celermajer DS, Chow CK, Marijon E, Anstey NM, Woo KS. Cardiovascular disease in the developing world: prevalences, patterns, and the potential of early disease detection. J Am Coll Cardiol. 2012;60:1207–1216. - PubMed
    1. Cuneo AA, Autieri MV. Expression and function of anti-inflammatory interleukins: the other side of the vascular response to injury. Curr Vasc Pharmacol. 2009;7:267–276. - PMC - PubMed
    1. Libby P. Inflammation in atherosclerosis. Arterioscler Thromb Vasc Biol. 2012;32:2045–2051. - PMC - PubMed
    1. Owens GK, Kumar MS, Wamhoff BR. Molecular regulation of vascular smooth muscle cell differentiation in development and disease. Physiol Rev. 2004;84:767–801. - PubMed

Publication types

MeSH terms