Comparative Study
. 2015 Jan 7:9:349-417.
doi: 10.2147/DDDT.S71677. eCollection 2015.

Plumbagin elicits differential proteomic responses mainly involving cell cycle, apoptosis, autophagy, and epithelial-to-mesenchymal transition pathways in human prostate cancer PC-3 and DU145 cells

Affiliations
Comparative Study

Plumbagin elicits differential proteomic responses mainly involving cell cycle, apoptosis, autophagy, and epithelial-to-mesenchymal transition pathways in human prostate cancer PC-3 and DU145 cells

Jia-Xuan Qiu et al. Drug Des Devel Ther. .

Abstract

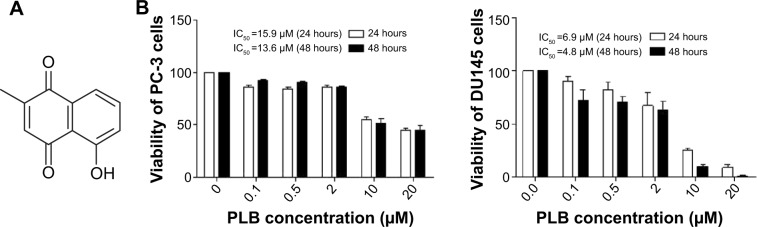
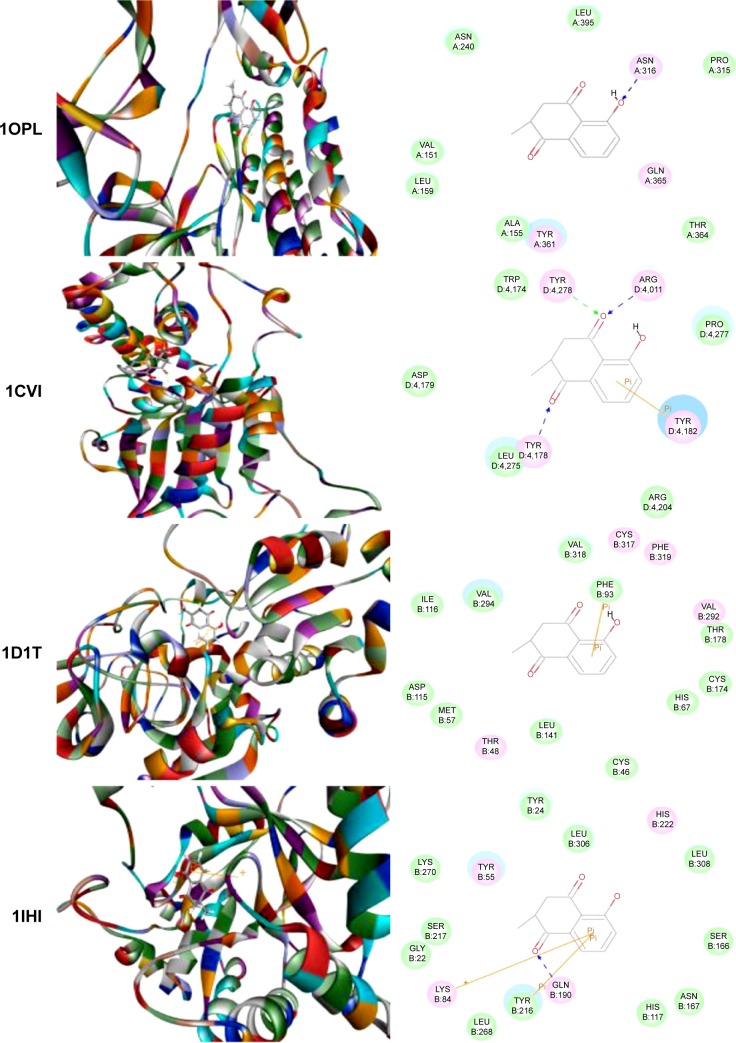
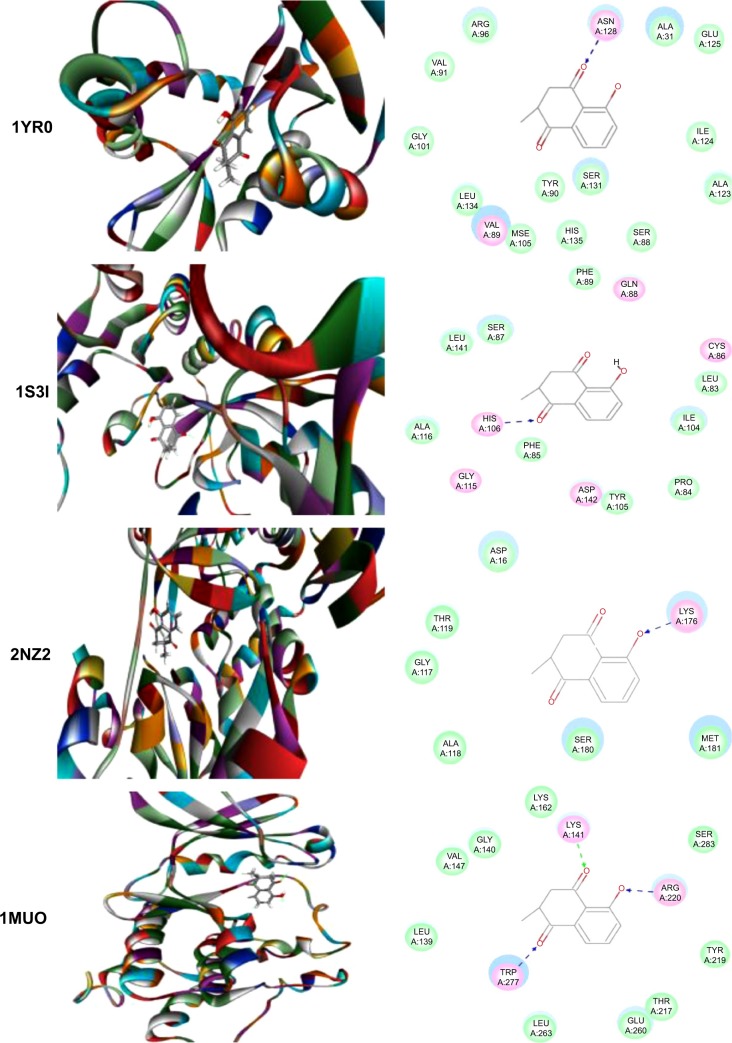
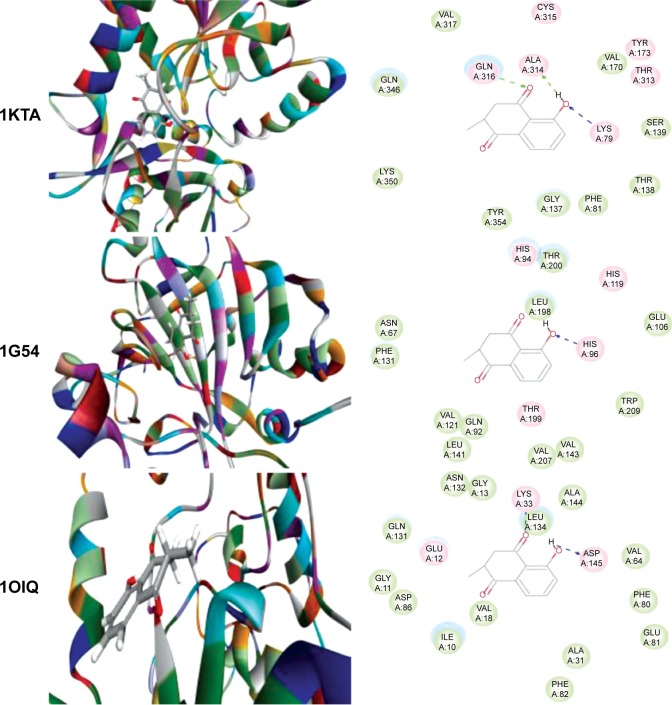
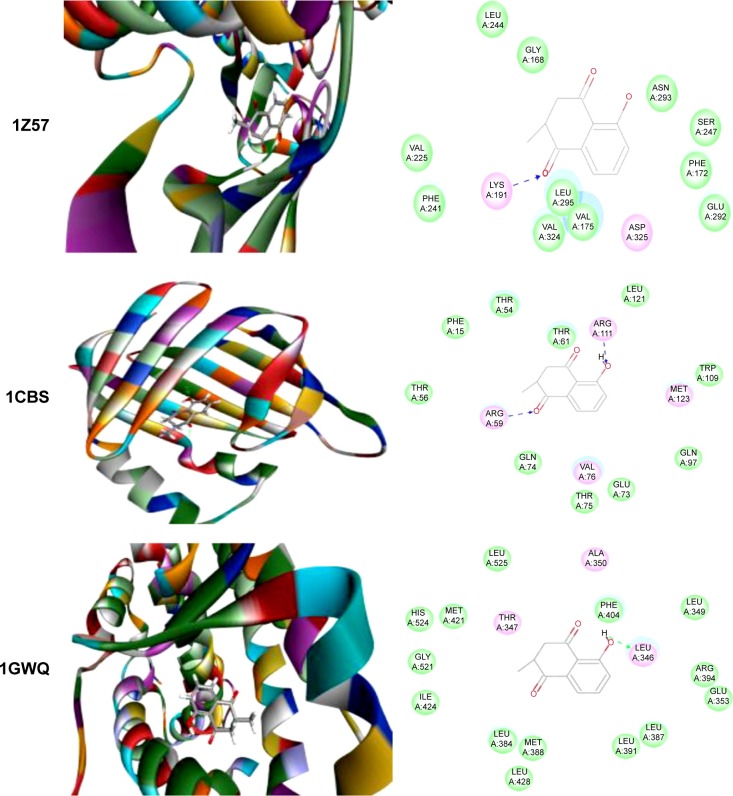
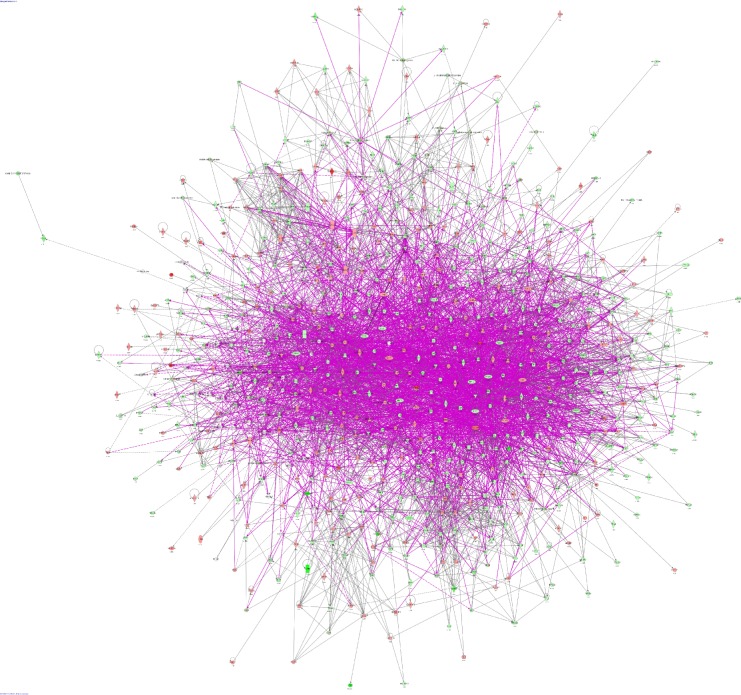
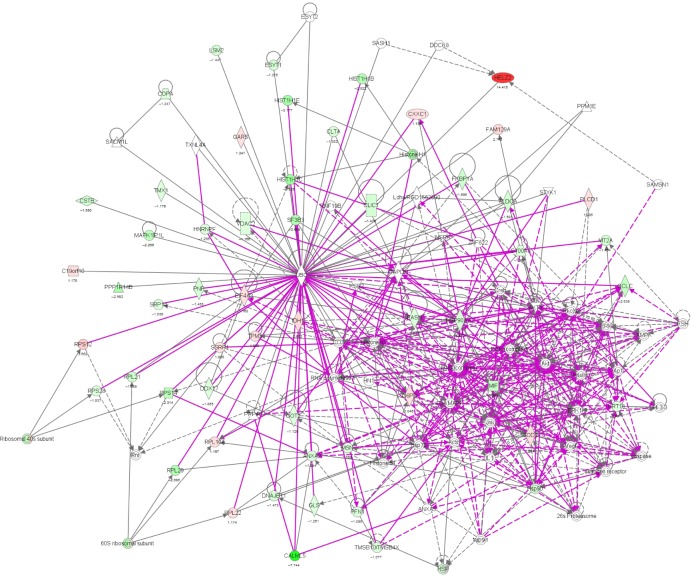
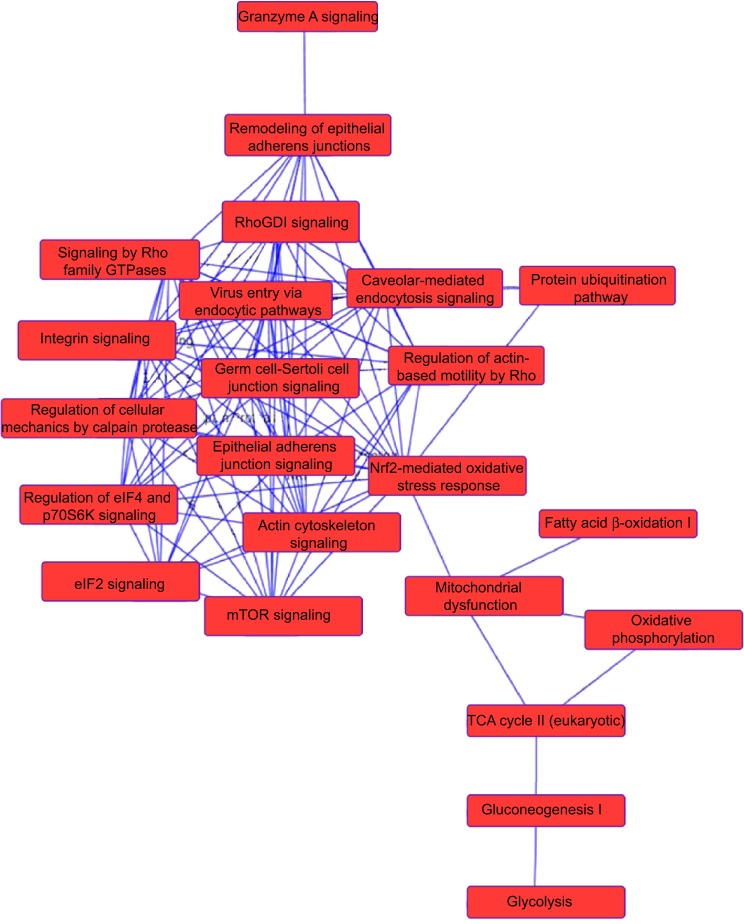
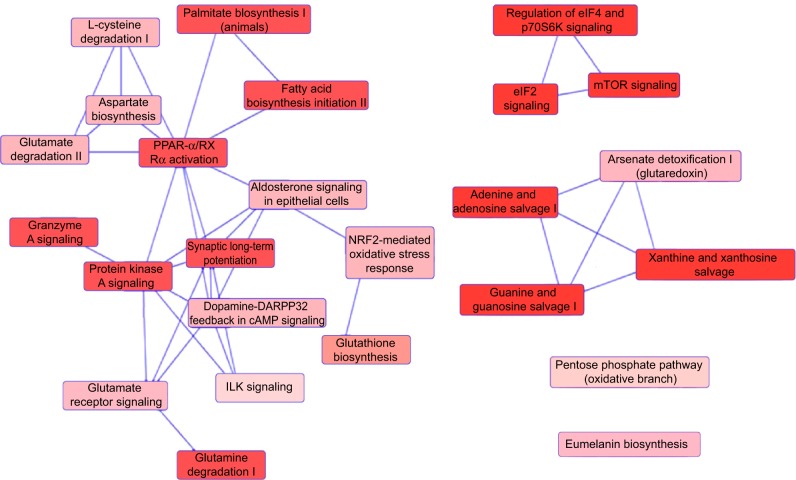
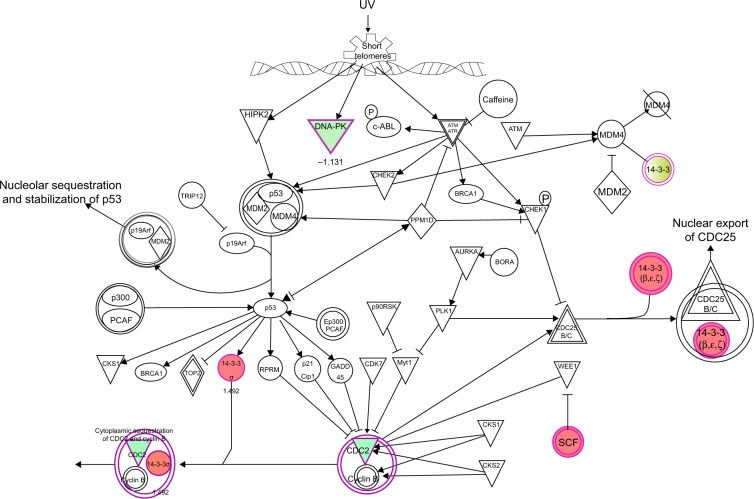
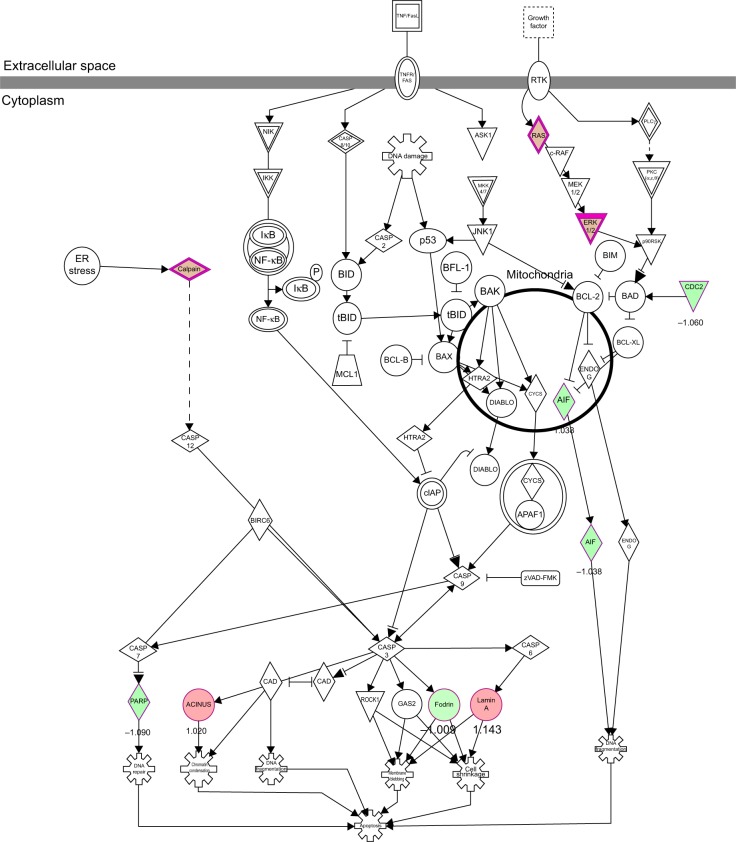
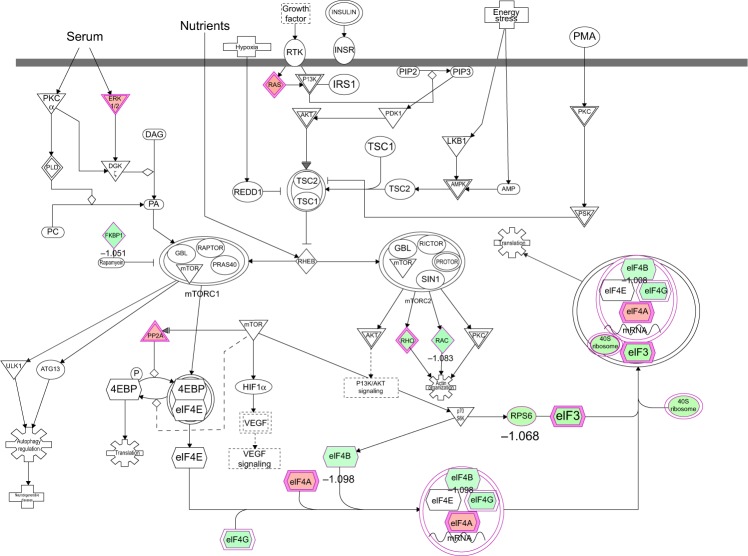
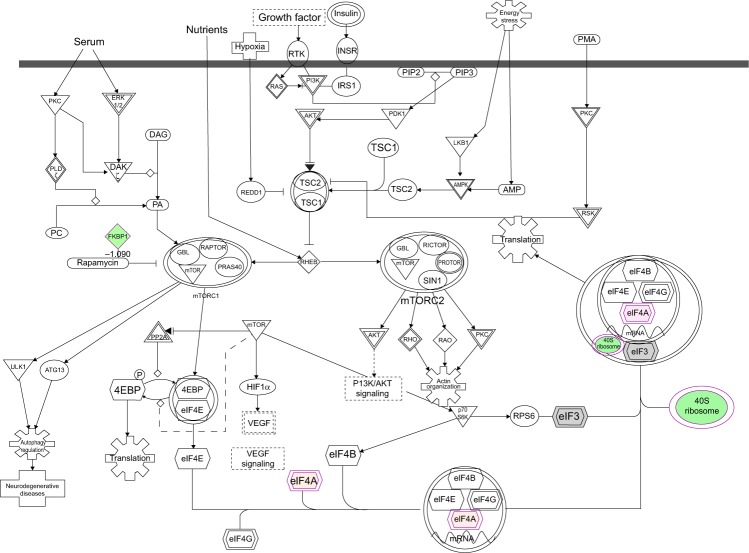
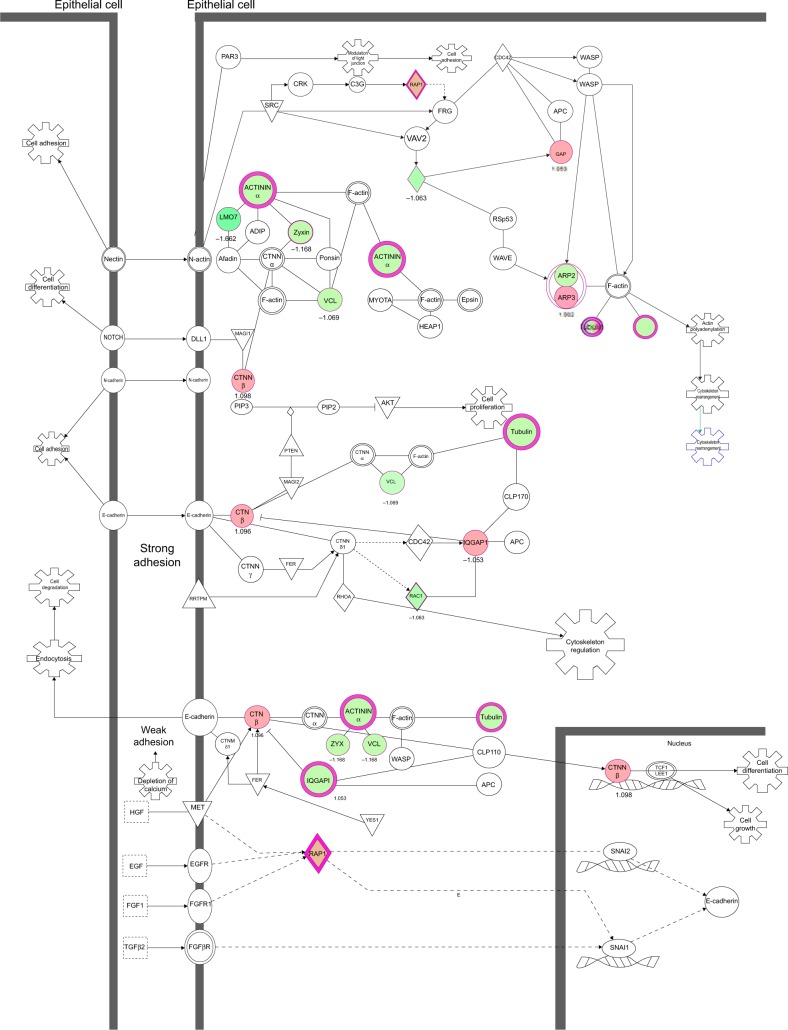
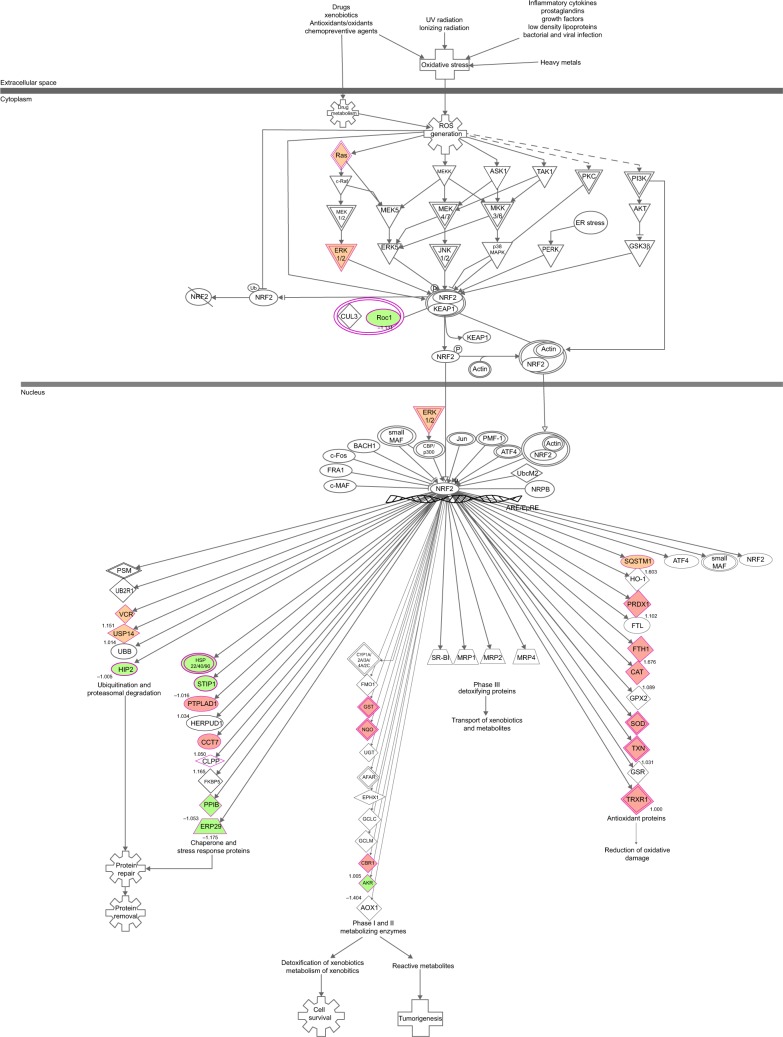
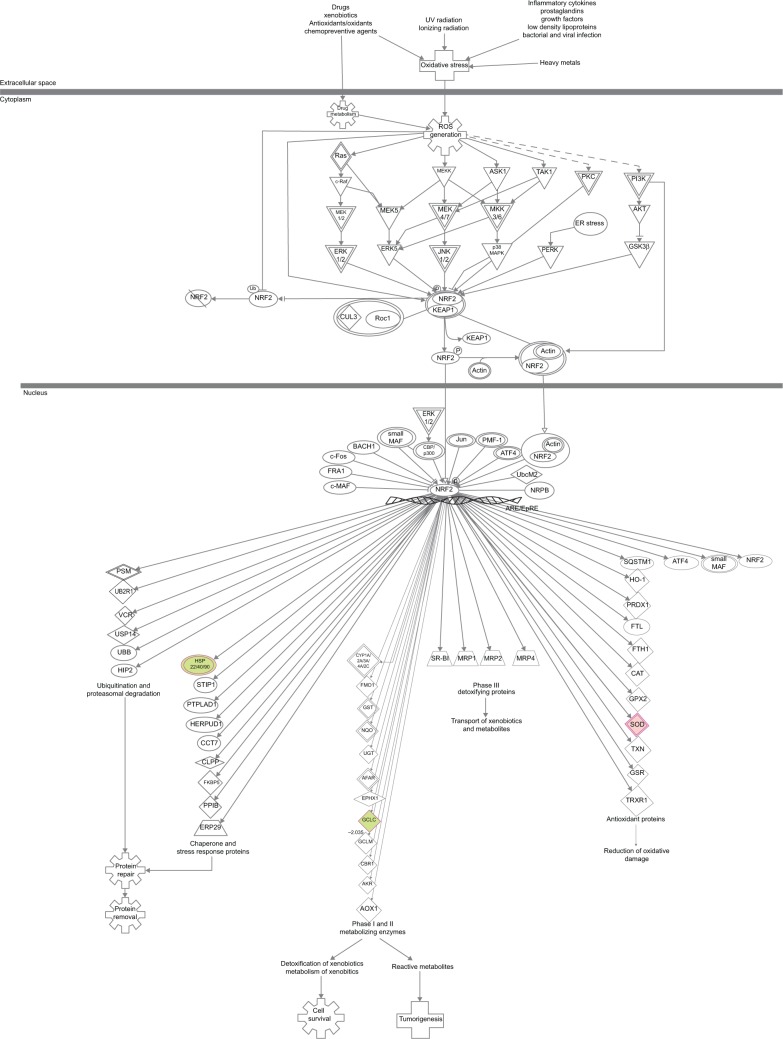
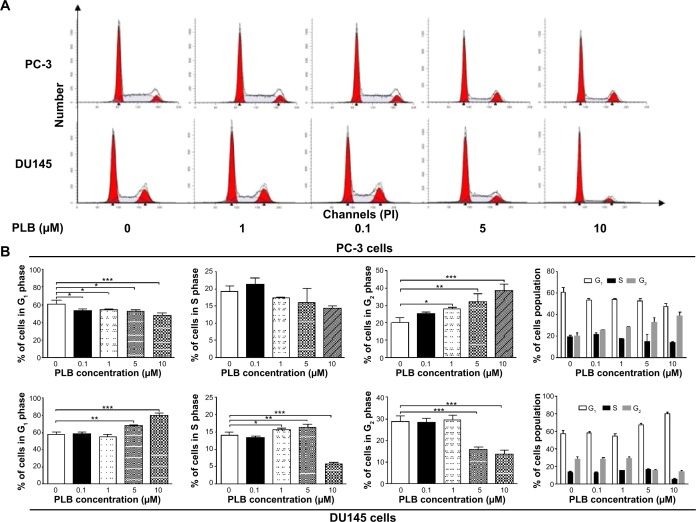
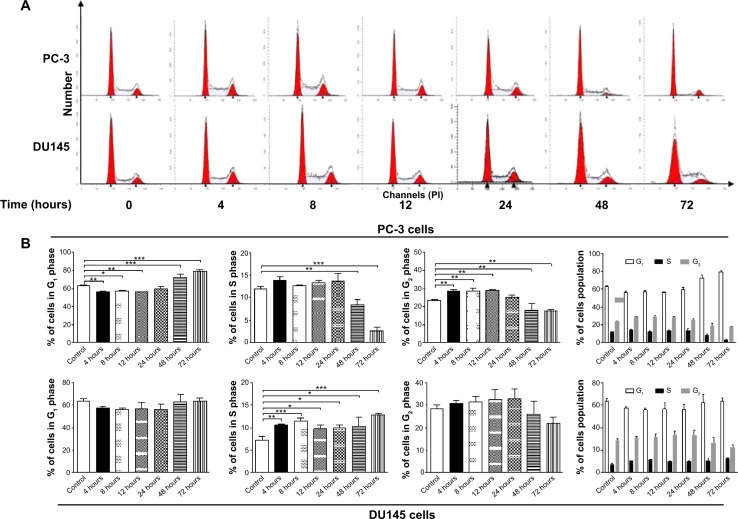
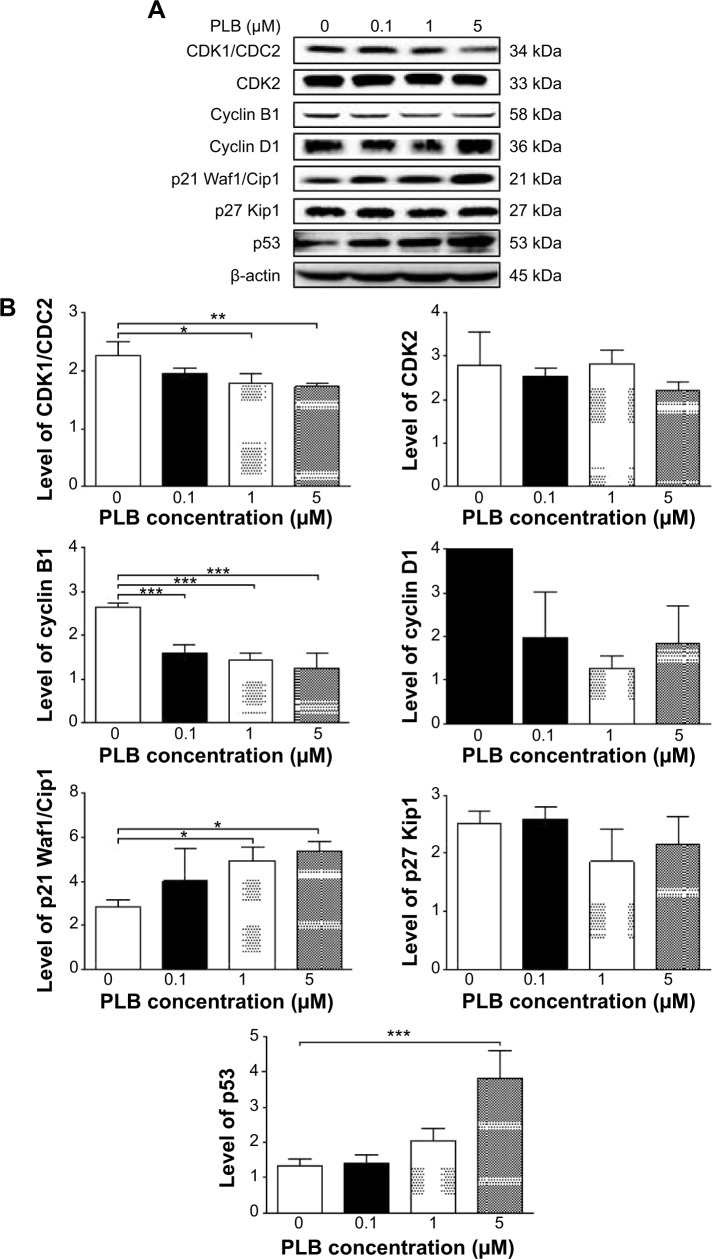
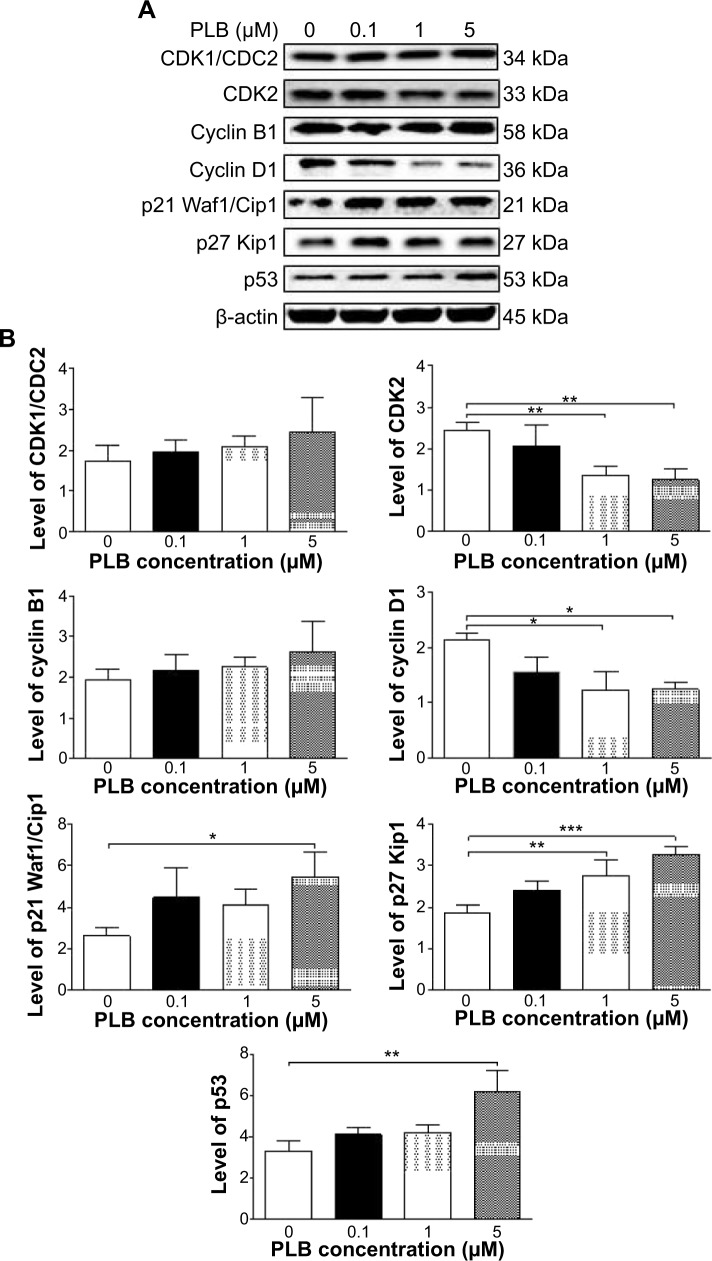
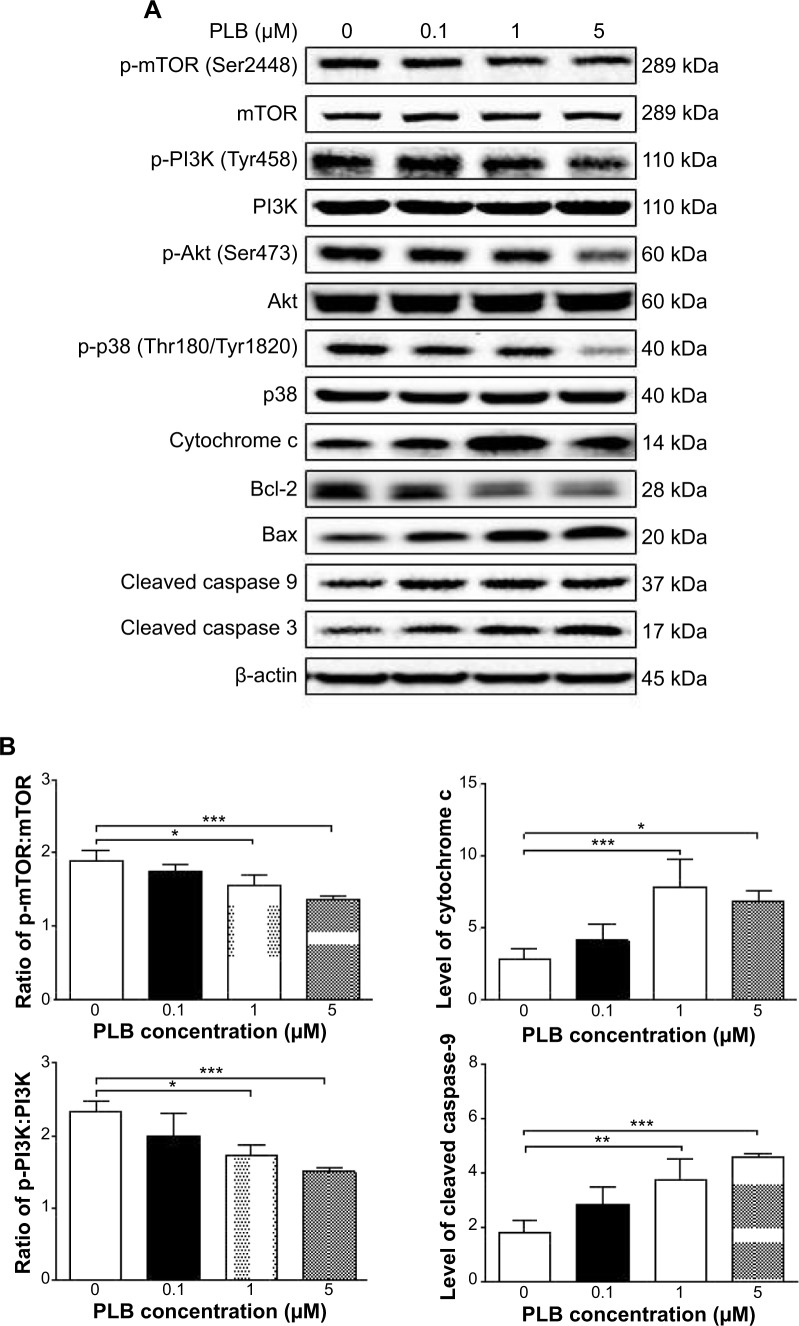
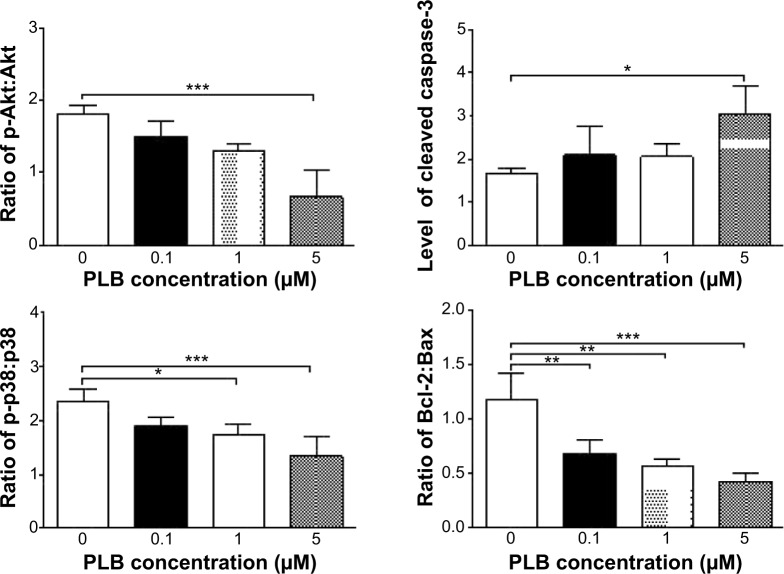
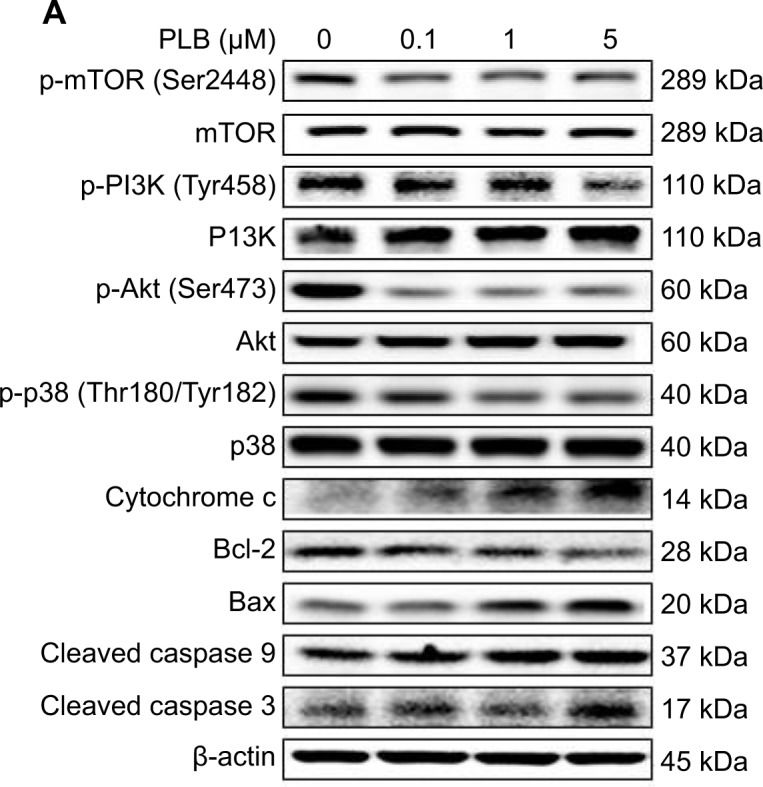
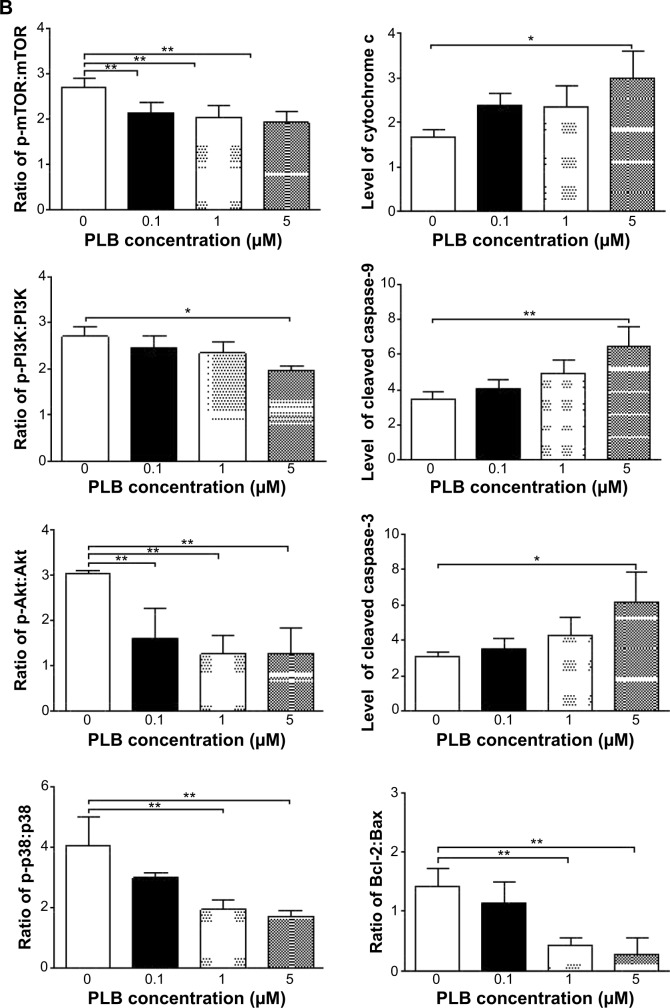
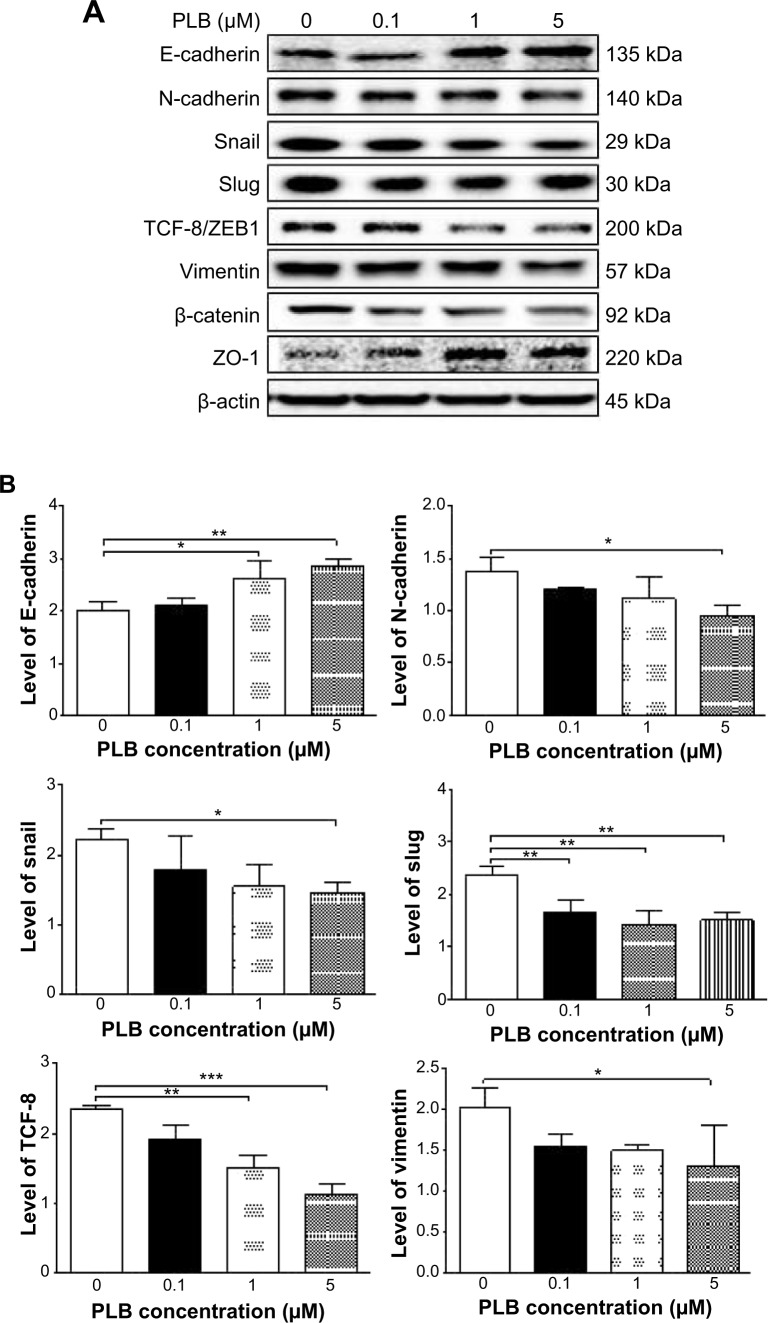
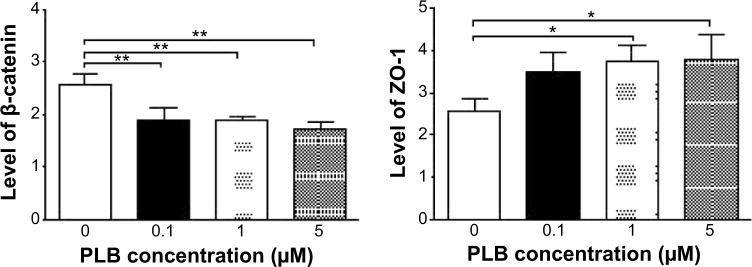
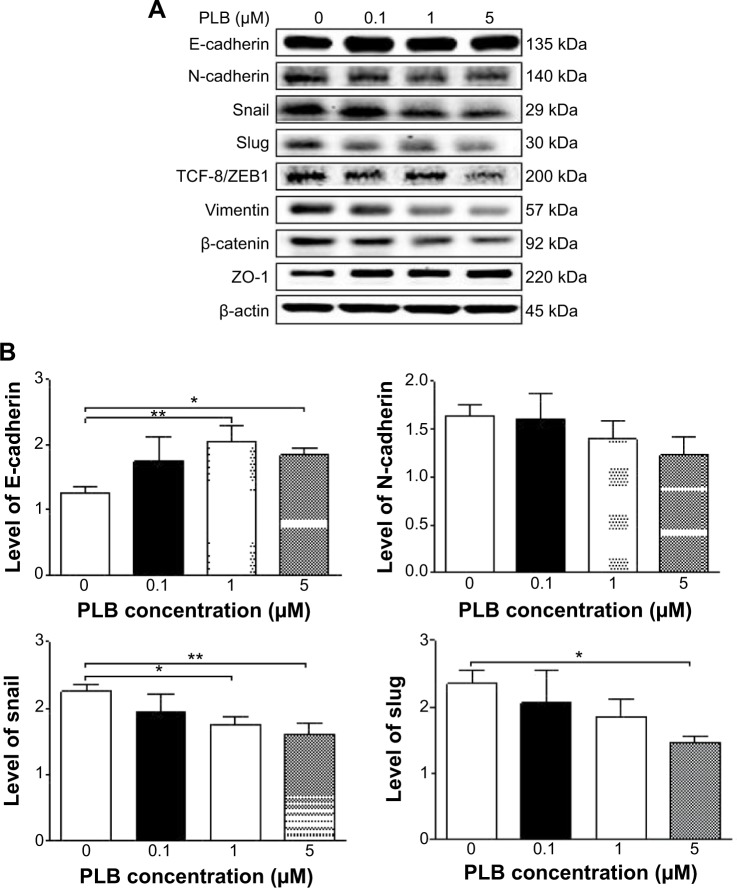
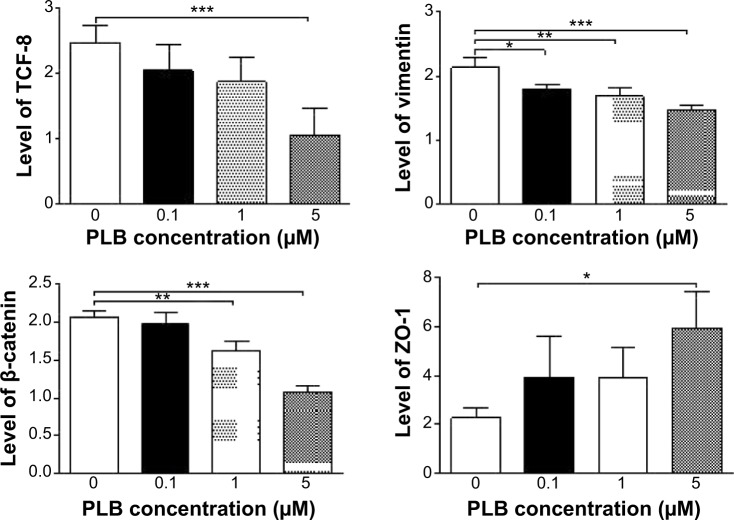
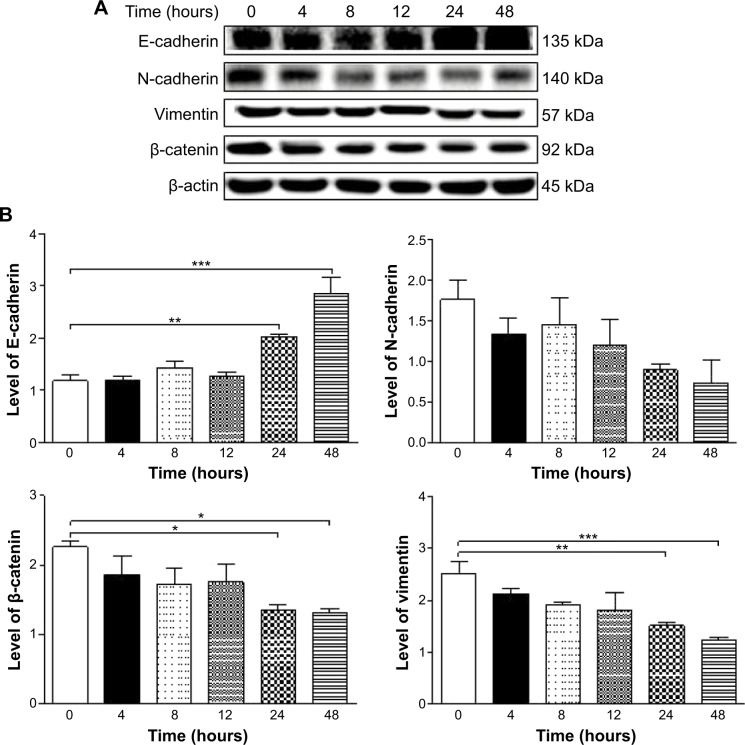
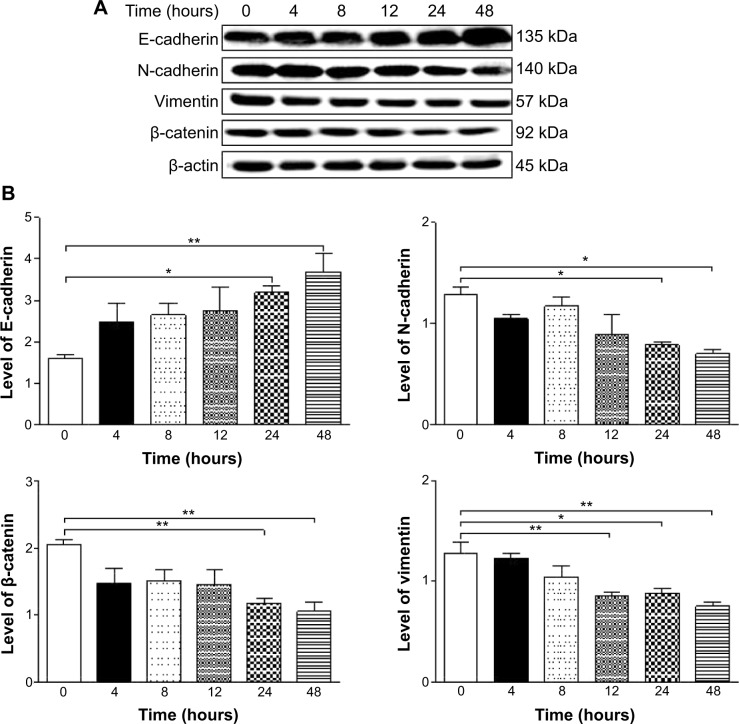
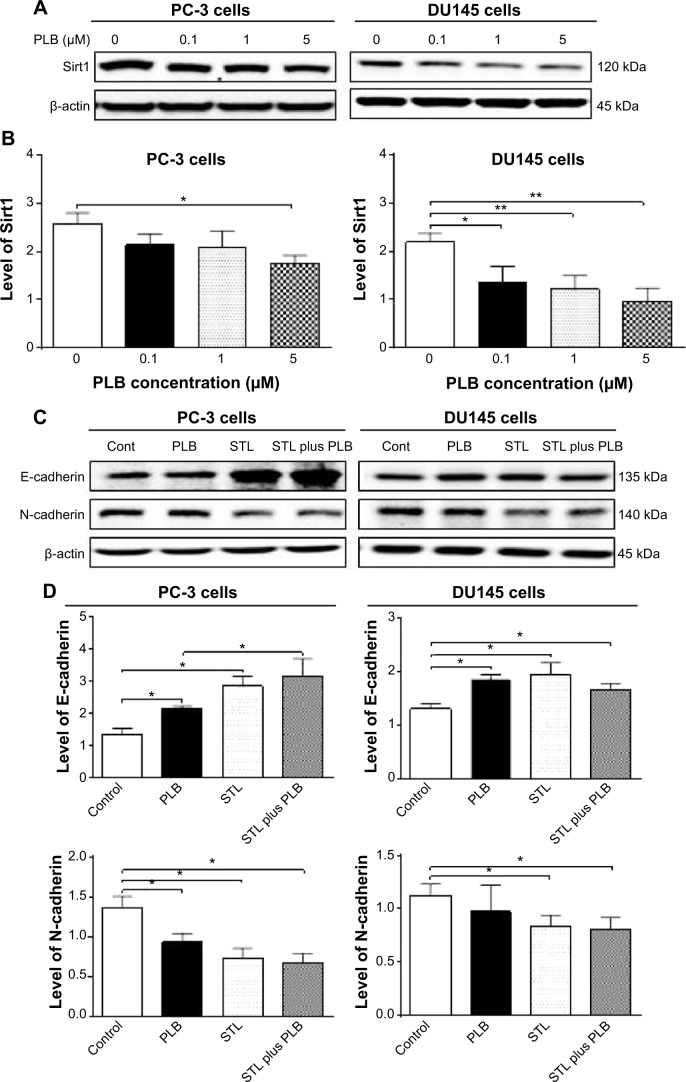
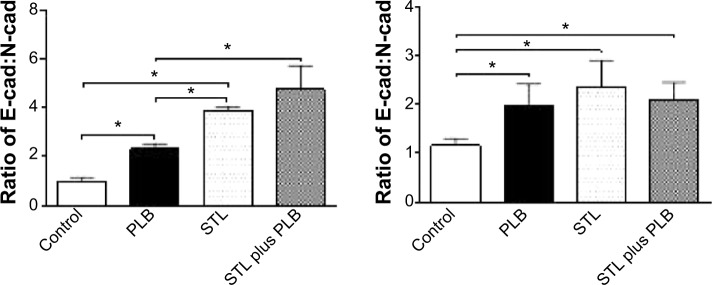
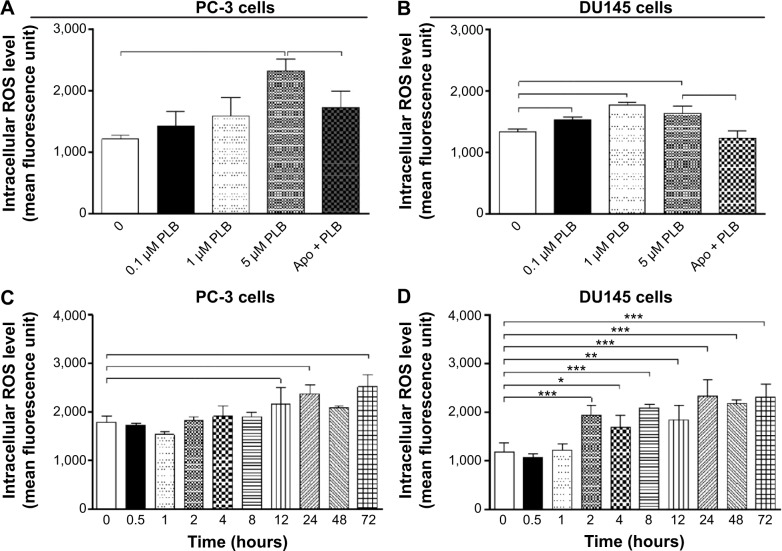
Plumbagin (PLB) has exhibited a potent anticancer effect in preclinical studies, but the molecular interactome remains elusive. This study aimed to compare the quantitative proteomic responses to PLB treatment in human prostate cancer PC-3 and DU145 cells using the approach of stable-isotope labeling by amino acids in cell culture (SILAC). The data were finally validated using Western blot assay. First, the bioinformatic analysis predicted that PLB could interact with 78 proteins that were involved in cell proliferation and apoptosis, immunity, and signal transduction. Our quantitative proteomic study using SILAC revealed that there were at least 1,225 and 267 proteins interacting with PLB and there were 341 and 107 signaling pathways and cellular functions potentially regulated by PLB in PC-3 and DU145 cells, respectively. These proteins and pathways played a critical role in the regulation of cell cycle, apoptosis, autophagy, epithelial to mesenchymal transition (EMT), and reactive oxygen species generation. The proteomic study showed substantial differences in response to PLB treatment between PC-3 and DU145 cells. PLB treatment significantly modulated the expression of critical proteins that regulate cell cycle, apoptosis, and EMT signaling pathways in PC-3 cells but not in DU145 cells. Consistently, our Western blotting analysis validated the bioinformatic and proteomic data and confirmed the modulating effects of PLB on important proteins that regulated cell cycle, apoptosis, autophagy, and EMT in PC-3 and DU145 cells. The data from the Western blot assay could not display significant differences between PC-3 and DU145 cells. These findings indicate that PLB elicits different proteomic responses in PC-3 and DU145 cells involving proteins and pathways that regulate cell cycle, apoptosis, autophagy, reactive oxygen species production, and antioxidation/oxidation homeostasis. This is the first systematic study with integrated computational, proteomic, and functional analyses revealing the networks of signaling pathways and differential proteomic responses to PLB treatment in prostate cancer cells. Quantitative proteomic analysis using SILAC represents an efficient and highly sensitive approach to identify the target networks of anticancer drugs like PLB, and the data may be used to discriminate the molecular and clinical subtypes, and to identify new therapeutic targets and biomarkers, for prostate cancer. Further studies are warranted to explore the potential of quantitative proteomic analysis in the identification of new targets and biomarkers for prostate cancer.

Keywords: EMT; SILAC; proteomics.


Figures

Figure 1
Figure 1
Chemical structure of PLB (5-hydroxy-2-methyl-1,4-naphthoquinone) and effect of PLB on cell viability in PC-3 and DU145 cells. Notes: PC-3 and DU145 cells were treated with PLB at 0.1 to 20 μM for 24 or 48 hours. (A) Chemical structure of PLB, and (B) cell viability of PC-3 and DU145 cells. Data are the mean ± SD of three independent experiments. Abbreviation: IC50, half maximal inhibitory concentration; PLB, plumbagin; SD, standard deviation.
Figure 2
Figure 2
Molecular interactions between PLB and selected predicted targets. Notes: Protein structure identifications from PDB. ABL1 (ID: 1OPL); ACPP (ID: 1CVI); ADH7 (ID: 1D1T); and AKR1C1 (ID: 1IHI). Abbreviations: ABL1, c-Abl oncogene 1; ACPP, prostate acid phosphatase; ADH7, alcohol dehydrogenase 5; AKR1C1, aldo–keto reductase family 1, member C1; PDB, Protein Data Bank; PLB, plumbagin.
Figure 3
Figure 3
Molecular interactions between PLB and selected predicted targets. Notes: Protein structure identifications from PDB. AKR1C3 (ID: 1YRO); ALDH1L1 (ID: 1S3I); ASS1 (ID: 2NZ2); and AURKA (ID: 1MUO). Abbreviations: AKR1C3, aldo–keto reductase family 1, member C3; ALDH1L1, aldehyde dehydrogenase 1 family, member L1; ASS1, argininosuccinate synthase 1; AURKA, aurora kinase A; PDB, Protein Data Bank; PLB, plumbagin.
Figure 4
Figure 4
Molecular interactions between PLB and selected predicted targets. Notes: Protein structure identifications from PDB. BCAT2 (ID: 1KTA); CA4 (ID: 1G54); and CDKN2A (ID: 1OIQ). Abbreviations: BCAT2, mitochondrial branched-chain amino-acid transaminase 2; CA4, carbonic anhydrase IV; CDKN2A, cyclin-dependent kinase inhibitor 2A; PDB, Protein Data Bank; PLB, plumbagin.
Figure 5
Figure 5
Molecular interactions between PLB and selected predicted targets. Notes: Protein structure identifications from PDB. CLK1 (ID: 1Z57); CRABP2 (ID: 1CBS); and ESR1/NR3A1 (ID:1GWQ). Abbreviations: CLK1, CDC-like kinase 1; CRABP2, cellular retinoic acid binding protein 2; ESR1/NR3A1, estrogen receptor-α; PDB, Protein Data Bank; PLB, plumbagin.
Figure 6
Figure 6
Proteomic analysis revealed molecular interactome regulated by PLB in PC-3 cells. Notes: PC-3 cells were treated with 5 μM PLB for 24 hours and the protein samples were subject to quantitative proteomic analysis. There were 1,225 molecules and 341 related pathways regulated by PLB in PC-3 cells. Red indicates an upregulation; green indicates a downregulation; brown indicates a predicted activation; and blue indicates a predicted inhibition. The intensity of green and red molecule colors indicates the degree of down- or upregulation, respectively. Solid arrows indicate direct interaction and dashed arrows indicate indirect interaction. Abbreviation: PLB, plumbagin.
Figure 7
Figure 7
Proteomic analysis revealed molecular interactome regulated by PLB in DU145 cells. Notes: DU145 cells were treated with 5 μM PLB for 24 hours and the protein samples were subject to quantitative proteomic analysis. There were 267 molecules and 107 related pathways regulated by PLB in DU145 cells. Red indicates an upregulation; green indicates a downregulation; brown indicates a predicted activation; and blue indicates a predicted inhibition. The intensity of green and red molecule colors indicates the degree of down- or upregulation, respectively. Solid arrows indicate direct interaction and dashed arrows indicate indirect interaction. Abbreviation: PLB, plumbagin.
Figure 8
Figure 8
Proteomic analysis revealed a network of signaling pathways regulated by PLB in PC-3 cells. Notes: A network of signaling pathways was analyzed by IPA according to the 1,225 molecules and 341 related pathways which were regulated by PLB in PC-3 cells. Abbreviations: IPA, Ingenuity Pathway Analysis; PLB, plumbagin; TCA, tricarboxylic acid cycle.
Figure 9
Figure 9
Proteomic analysis revealed networks of signaling pathways regulated by PLB in DU145 cells. Notes: Networks of signaling pathways were analyzed by IPA according to 267 molecules and 107 related pathways which were regulated by PLB in DU145 cells. Abbreviations: cAMP, cyclic adenosine monophosphate; IPA, Ingenuity Pathway Analysis; PLB, plumbagin.
Figure 10
Figure 10
PLB regulates cell cycle at G2/M checkpoint in PC-3 cells. Notes: PC-3 cells were treated with 5 μM PLB for 24 hours and the protein samples were subject to quantitative proteomic analysis. Red indicates an upregulation; green indicates a downregulation; brown indicates a predicted activation. The intensity of green and red molecule colors indicates the degree of down- or upregulation, respectively. Solid arrows indicates direct interaction. Abbreviations: PLB, plumbagin; UV, ultraviolet.
Figure 11
Figure 11
PLB regulates apoptosis signaling pathway in PC-3 cells. Notes: PC-3 cells were treated with 5 μM PLB for 24 hours and the protein samples were subject to quantitative proteomic analysis. Red indicates an upregulation; green indicates a downregulation. The intensity of green and red molecule colors indicates the degree of down- or upregulation, respectively. Solid arrows indicate direct interaction and dashed arrows indicate indirect interaction. Abbreviation: PLB, plumbagin.
Figure 12
Figure 12
mTOR signaling pathway regulated by PLB in PC-3 cells. Notes: PC-3 cells were treated with 5 μM PLB for 24 hours and the protein samples were subject to quantitative proteomic analysis. Red indicates an upregulation; green indicates a downregulation. The intensity of green and red molecule colors indicates the degree of down- or upregulation, respectively. Solid arrows indicate direct interaction and dashed arrows indicate indirect interaction. Abbreviation: PLB, plumbagin.
Figure 13
Figure 13
mTOR signaling pathway regulated by PLB in DU145 cells. Notes: DU145 cells were treated with 5 μM PLB for 24 hours and the protein samples were subject to quantitative proteomic analysis. Red indicates an upregulation; green indicates a downregulation. The intensity of green and red molecule colors indicates the degree of down- or upregulation, respectively. Solid arrows indicate direct interaction and dashed arrows indicate indirect interaction. Abbreviation: PLB, plumbagin.
Figure 14
Figure 14
PLB regulates epithelial adherent junction signaling pathway in PC-3 cells. Notes: PC-3 cells were treated with 5 μM PLB for 24 hours and the protein samples were subject to quantitative proteomic analysis. Red indicates an upregulation; green indicates a downregulation; brown indicates a predicted activation. The intensity of green and red molecule colors indicates the degree of down- or upregulation, respectively. Solid arrows indicate direct interaction and dashed arrows indicate indirect interaction. Abbreviation: PLB, plumbagin.
Figure 15
Figure 15
PLB-regulated Nrf2-mediated oxidative stress response in PC-3 cells. Notes: PC-3 cells were treated with 5 μM PLB for 24 hours and the protein samples were subject to quantitative proteomic analysis. Red indicates an upregulation; green indicates a downregulation; brown indicates a predicted activation. The intensity of green and red molecule colors indicates the degree of down- or upregulation, respectively. Solid arrows indicate direct interaction and dashed arrows indicate indirect interaction. Abbreviations: PLB, plumbagin; UV, ultraviolet.
Figure 16
Figure 16
PLB-regulated Nrf2-mediated oxidative stress response in DU145 cells. Notes: DU145 cells were treated with 5 μM PLB for 24 hours and the protein samples were subject to quantitative proteomic analysis. Red indicates an upregulation; green indicates a downregulation. The intensity of green and red molecule colors indicates the degree of down- or upregulation, respectively. Solid arrows indicate direct interaction and dashed arrows indicate indirect interaction. Abbreviations: PLB, plumbagin; UV, ultraviolet.
Figure 17
Figure 17
PLB inhibits the proliferation of PC-3 and DU145 cells, and induces G2/M arrest in PC-3 cells and G1 arrest in DU145 cells. Notes: Cell cycle distribution of PC-3 and DU145 cells with the treatment of PLB at 0.1 to 10 μM for 24 hours. (A) Representative flow cytometric plots of cell cycle distribution of PC-3 and DU145, and (B) bar graphs showing the percentage of PC-3 and DU145 cells in G1, S, and G2 phases. Data are the mean ± standard deviation of three independent experiments. *P<0.05; **P<0.01; and ***P<0.001 by one-way analysis of variance. Abbreviations: PI, propidium iodide; PLB, plumbagin.
Figure 18
Figure 18
Inhibitory effect of PLB on the proliferation of PC-3 and DU145 cells over 72 hours. Notes: The time course of PLB-induced cell cycle change over 72 hours in PC-3 and DU145 cells. (A) Representative flow cytometric plots of cell cycle distribution of PC-3 and DU145, and (B) bar graphs showing the percentage of PC-3 and DU145 cells in G1, S, and G2 phases. Data are the mean ± standard deviation of three independent experiments. *P<0.05; **P<0.01; and ***P<0.001 by one-way analysis of variance. Abbreviations: PI, propidium iodide; PLB, plumbagin.
Figure 19
Figure 19
PLB regulates the expression of CDK1/CDC2, cyclin B1, CDK2, cyclin D1, p21 Waf1/Cip1, p27 Kip1, and p53 in PC-3 cells. Notes: PC-3 cells were treated with PLB at 0.1, 1, and 5 μM for 24 hours and protein samples were subject to Western blot assay. (A) Representative blots of CDK1/CDC2, cyclin B1, CDK2, cyclin D1, p21 Waf1/Cip1, p27 Kip1, p53, and β-actin in PC-3 cells, and (B) bar graphs showing the relative levels of CDK1/CDC2, cyclin B1, CDK2, cyclin D1, p21 Waf1/Cip1, p27 Kip1, and p53 in PC-3 cells. Data are the mean ± standard deviation of three independent experiments. *P<0.05; **P<0.01; and ***P<0.001 by one-way analysis of variance. Abbreviation: PLB, plumbagin.
Figure 20
Figure 20
PLB regulates the expression of CDK1/CDC2, cyclin B1, CDK2, cyclin D1, p21 Waf1/Cip1, p27 Kip1, and p53 in DU145 cells. Notes: DU145 cells were treated with PLB at 0.1, 1, and 5 μM for 24 hours and protein samples were subject to Western blot assay. (A) Representative blots of CDK1/CDC2, cyclin B1, CDK2, cyclin D1, p21 Waf1/Cip1, p27 Kip1, p53, and β-actin in DU145 cells, and (B) bar graphs showing the relative levels of CDK1/CDC2, cyclin B1, CDK2, cyclin D1, p21 Waf1/Cip1, p27 Kip1, and p53 in DU145 cells. Data are the mean ± standard deviation of three independent experiments. *P<0.05; **P<0.01; and ***P<0.001 by one-way analysis of variance. Abbreviation: PLB, plumbagin.
Figure 21
Figure 21
Effects of PLB treatment on the expression and phosphorylation levels of PI3K, Akt, mTOR, p38MAPK, and cytochrome c in PC-3 cells. Notes: PC-3 cells were treated with PLB at 0.1, 1, and 5 μM for 24 hours and protein samples were subject to Western blot assay. (A) Representative blots of p- and t-PI3K, p- and t-Akt, p- and t-mTOR, p- and t-p38MAPK, and cytochrome c in PC-3 cells, and (B) bar graphs showing the relative levels of p/t-PI3K, p/t-Akt, p/t-mTOR, p/tp38MAPK, and cytochrome c in PC-3 cells. Data are the mean ± standard deviation of three independent experiments. *P<0.05; **P<0.01; and ***P<0.001 by one-way analysis of variance. Abbreviation: PLB, plumbagin.
Figure 21
Figure 21
Effects of PLB treatment on the expression and phosphorylation levels of PI3K, Akt, mTOR, p38MAPK, and cytochrome c in PC-3 cells. Notes: PC-3 cells were treated with PLB at 0.1, 1, and 5 μM for 24 hours and protein samples were subject to Western blot assay. (A) Representative blots of p- and t-PI3K, p- and t-Akt, p- and t-mTOR, p- and t-p38MAPK, and cytochrome c in PC-3 cells, and (B) bar graphs showing the relative levels of p/t-PI3K, p/t-Akt, p/t-mTOR, p/tp38MAPK, and cytochrome c in PC-3 cells. Data are the mean ± standard deviation of three independent experiments. *P<0.05; **P<0.01; and ***P<0.001 by one-way analysis of variance. Abbreviation: PLB, plumbagin.
Figure 22
Figure 22
Effects of PLB treatment on the expression and phosphorylation levels of PI3K, Akt, mTOR, p38MAPK, and cytochrome c in DU145 cells. Notes: DU145 cells were treated with PLB at 0.1, 1, and 5 μM for 24 hours and protein samples were subject to Western blot assay. (A) Representative blots of p- and t-PI3K, p- and t-Akt, p- and t-mTOR, p- and t-p38MAPK, and cytochrome c in DU145 cells, and (B) bar graphs showing the relative levels of p/t-PI3K, p/t-Akt, p/t-mTOR, p/tp38MAPK, and cytochrome c in DU145 cells. Data are the mean ± standard deviation of three independent experiments. *P<0.05; **P<0.01 by one-way analysis of variance. Abbreviation: PLB, plumbagin.
Figure 22
Figure 22
Effects of PLB treatment on the expression and phosphorylation levels of PI3K, Akt, mTOR, p38MAPK, and cytochrome c in DU145 cells. Notes: DU145 cells were treated with PLB at 0.1, 1, and 5 μM for 24 hours and protein samples were subject to Western blot assay. (A) Representative blots of p- and t-PI3K, p- and t-Akt, p- and t-mTOR, p- and t-p38MAPK, and cytochrome c in DU145 cells, and (B) bar graphs showing the relative levels of p/t-PI3K, p/t-Akt, p/t-mTOR, p/tp38MAPK, and cytochrome c in DU145 cells. Data are the mean ± standard deviation of three independent experiments. *P<0.05; **P<0.01 by one-way analysis of variance. Abbreviation: PLB, plumbagin.
Figure 23
Figure 23
Dose effect of PLB on the expression level of selected EMT markers in PC-3 cells. Notes: PC-3 cells were treated with PLB at 0.1, 1, and 5 μM for 24 hours and protein samples were subject to Western blot assay. (A) Representative blots of E-cadherin, N-cadherin, snail, slug, TCF-8/ZEB1, vimentin, β-catenin, ZO-1, and β-actin in PC-3 cells treated with PLB at 0.1, 1, and 5 μM for 24 hours, and (B) bar graphs showing the levels of E-cadherin, N-cadherin, snail, slug, TCF-8/ZEB1, vimentin, β-catenin, and ZO-1 in PC-3 cells. Data represent the mean ± standard deviation of three independent experiments.*P<0.05; **P<0.01; ***P<0.001 by one-way analysis of variance. Abbreviations: EMT, epithelial–mesenchymal transition; PLB, plumbagin.
Figure 23
Figure 23
Dose effect of PLB on the expression level of selected EMT markers in PC-3 cells. Notes: PC-3 cells were treated with PLB at 0.1, 1, and 5 μM for 24 hours and protein samples were subject to Western blot assay. (A) Representative blots of E-cadherin, N-cadherin, snail, slug, TCF-8/ZEB1, vimentin, β-catenin, ZO-1, and β-actin in PC-3 cells treated with PLB at 0.1, 1, and 5 μM for 24 hours, and (B) bar graphs showing the levels of E-cadherin, N-cadherin, snail, slug, TCF-8/ZEB1, vimentin, β-catenin, and ZO-1 in PC-3 cells. Data represent the mean ± standard deviation of three independent experiments.*P<0.05; **P<0.01; ***P<0.001 by one-way analysis of variance. Abbreviations: EMT, epithelial–mesenchymal transition; PLB, plumbagin.
Figure 24
Figure 24
Dose-effect of PLB on the expression level of selected EMT markers in DU145 cells. Notes: DU145 cells were treated with PLB at 0.1, 1, and 5 μM for 24 hours and protein samples were subject to Western blot assay. (A) Representative blots of E-cadherin, N-cadherin, snail, slug, TCF-8/ZEB1, vimentin, β-catenin, ZO-1, and β-actin in DU145 cells treated with PLB at 0.1, 1, and 5 μM for 24 hours, and (B) bar graphs showing the levels of E-cadherin, N-cadherin, snail, slug, TCF-8/ZEB1, vimentin, β-catenin, and ZO-1 in DU145 cells. Data represent the mean ± standard deviation of three independent experiments. *P<0.05; **P<0.01; ***P<0.001 by one-way analysis of variance. Abbreviations: EMT, epithelial–mesenchymal transition; PLB, plumbagin.
Figure 24
Figure 24
Dose-effect of PLB on the expression level of selected EMT markers in DU145 cells. Notes: DU145 cells were treated with PLB at 0.1, 1, and 5 μM for 24 hours and protein samples were subject to Western blot assay. (A) Representative blots of E-cadherin, N-cadherin, snail, slug, TCF-8/ZEB1, vimentin, β-catenin, ZO-1, and β-actin in DU145 cells treated with PLB at 0.1, 1, and 5 μM for 24 hours, and (B) bar graphs showing the levels of E-cadherin, N-cadherin, snail, slug, TCF-8/ZEB1, vimentin, β-catenin, and ZO-1 in DU145 cells. Data represent the mean ± standard deviation of three independent experiments. *P<0.05; **P<0.01; ***P<0.001 by one-way analysis of variance. Abbreviations: EMT, epithelial–mesenchymal transition; PLB, plumbagin.
Figure 25
Figure 25
Effects of PLB on the expression level of selected EMT markers in PC-3 cells over 48 hours. Notes: PC-3 cells were treated with 5 μM PLB over 48 hours and protein samples were subject to Western blot assay. (A) Representative blots of E-cadherin, N-cadherin, vimentin, β-catenin, and β-actin in PC-3 cells, and (B) bar graphs showing the levels of E-cadherin, N-cadherin, vimentin, and β-catenin in PC-3 cells. Data represent the mean ± standard deviation of three independent experiments. *P<0.05; **P<0.01; ***P<0.001 by one-way analysis of variance. Abbreviations: EMT, epithelial–mesenchymal transition; PLB, plumbagin.
Figure 26
Figure 26
Effects of PLB on the expression level of selected EMT markers in DU145 cells over 48 hours. Notes: DU145 cells were treated with 5 μM PLB over 48 hours and protein samples were subject to Western blot assay. (A) Representative blots of E-cadherin, N-cadherin, vimentin, β-catenin, and β-actin in DU145 cells, and (B) bar graphs showing the levels of E-cadherin, N-cadherin, vimentin, and β-catenin in DU145 cells. Data represent the mean ± standard deviation of three independent experiments. *P<0.05; **P<0.01 by one-way analysis of variance. Abbreviations: EMT, epithelial–mesenchymal transition; PLB, plumbagin.
Figure 27
Figure 27
The role of Sirt-1 in PLB-induced EMT inhibition in PC-3 and DU145 cells. Notes: Cells were treated with PLB at 0.1, 1, and 5 μM for 24 hours and protein samples were subject to Western blot assay. (A) Representative blots of Sirt 1 and β-actin in PC-3 and DU145 cells; (B) bar graphs showing the relative expression level of Sirt-1 in PC-3 and DU145 cells; (C) representative blots of E-cadherin, N-cadherin, and β-actin in PC-3 and DU145 cells; and (D) bar graphs showing the relative expression level of E-cadherin and N-cadherin in PC-3 and DU145 cells. Data are the mean ± standard deviation of three independent experiments. *P<0.05; **P<0.01 by one-way analysis of variance. Abbreviations: EMT, epithelial–mesenchymal transition; PLB, plumbagin; STL, sirtinol.
Figure 27
Figure 27
The role of Sirt-1 in PLB-induced EMT inhibition in PC-3 and DU145 cells. Notes: Cells were treated with PLB at 0.1, 1, and 5 μM for 24 hours and protein samples were subject to Western blot assay. (A) Representative blots of Sirt 1 and β-actin in PC-3 and DU145 cells; (B) bar graphs showing the relative expression level of Sirt-1 in PC-3 and DU145 cells; (C) representative blots of E-cadherin, N-cadherin, and β-actin in PC-3 and DU145 cells; and (D) bar graphs showing the relative expression level of E-cadherin and N-cadherin in PC-3 and DU145 cells. Data are the mean ± standard deviation of three independent experiments. *P<0.05; **P<0.01 by one-way analysis of variance. Abbreviations: EMT, epithelial–mesenchymal transition; PLB, plumbagin; STL, sirtinol.
Figure 28
Figure 28
Effect of PLB on the intracellular ROS generation in PC-3 and DU145 cells. Notes: Intracellular ROS level in PC-3 (A) and DU145 (B) cells treated with PLB at 0.1, 1, and 5 μM for 24 hours; and intracellular ROS level in PC-3 (C) and DU145 (D) cells treated with 5 μM PLB over 72 hours. Data are the mean ± standard deviation of three independent experiments. *P<0.05; **P<0.01, and ***P<0.001 by one-way analysis of variance. Abbreviations: Apo, apocynin; PLB, plumbagin; ROS, reactive oxygen species.

Similar articles

Cited by

References

    1. Ahmed HU. Prostate cancer: Time for active surveillance of intermediate-risk disease? Nat Rev Urol. 2013;10(1):6–8. - PubMed
    1. Ferlay J, Soerjomataram I, Ervik M, et al. GLOBOCAN 2012 v.10, Cancer Incidence and Mortality Worldwide: IARC CancerBase No. 11. [homepage on the Internet] Lyon, France: International Agency for Research on Cancer; 2013. [accessed on November 7, 2014]. Available from: http://globocan.iarc.fr.
    1. Ferlay J, Shin HR, Bray F, Forman D, Mathers C, Parkin DM. Estimates of worldwide burden of cancer in 2008: GLOBOCAN 2008. Int J Cancer. 2010;127(12):2893–2917. - PubMed
    1. Soerjomataram I, Lortet-Tieulent J, Parkin DM, et al. Global burden of cancer in 2008: a systematic analysis of disability-adjusted life-years in 12 world regions. Lancet. 2012;380(9856):1840–1850. - PubMed
    1. Gunderson K, Wang CY, Wang R. Global prostate cancer incidence and the migration, settlement, and admixture history of the Northern Europeans. Cancer Epidemiol. 2011;35(4):320–327. - PMC - PubMed

Publication types

MeSH terms