Severe acute respiratory syndrome coronaviruses with mutations in the E protein are attenuated and promising vaccine candidates
- PMID: 25609816
- PMCID: PMC4403406
- DOI: 10.1128/JVI.03566-14
Severe acute respiratory syndrome coronaviruses with mutations in the E protein are attenuated and promising vaccine candidates
Abstract
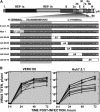
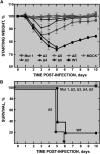
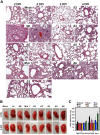
Severe acute respiratory syndrome coronavirus (SARS-CoV) causes a respiratory disease with a mortality rate of 10%. A mouse-adapted SARS-CoV (SARS-CoV-MA15) lacking the envelope (E) protein (rSARS-CoV-MA15-ΔE) is attenuated in vivo. To identify E protein regions and host responses that contribute to rSARS-CoV-MA15-ΔE attenuation, several mutants (rSARS-CoV-MA15-E*) containing point mutations or deletions in the amino-terminal or the carboxy-terminal regions of the E protein were generated. Amino acid substitutions in the amino terminus, or deletion of regions in the internal carboxy-terminal region of E protein, led to virus attenuation. Attenuated viruses induced minimal lung injury, diminished limited neutrophil influx, and increased CD4(+) and CD8(+) T cell counts in the lungs of BALB/c mice, compared to mice infected with the wild-type virus. To analyze the host responses leading to rSARS-CoV-MA15-E* attenuation, differences in gene expression elicited by the native and mutant viruses in the lungs of infected mice were determined. Expression levels of a large number of proinflammatory cytokines associated with lung injury were reduced in the lungs of rSARS-CoV-MA15-E*-infected mice, whereas the levels of anti-inflammatory cytokines were increased, both at the mRNA and protein levels. These results suggested that the reduction in lung inflammation together with a more robust antiviral T cell response contributed to rSARS-CoV-MA15-E* attenuation. The attenuated viruses completely protected mice against challenge with the lethal parental virus, indicating that these viruses are promising vaccine candidates.
Importance: Human coronaviruses are important zoonotic pathogens. SARS-CoV caused a worldwide epidemic infecting more than 8,000 people with a mortality of around 10%. Therefore, understanding the virulence mechanisms of this pathogen and developing efficacious vaccines are of high importance to prevent epidemics from this and other human coronaviruses. Previously, we demonstrated that a SARS-CoV lacking the E protein was attenuated in vivo. Here, we show that small deletions and modifications within the E protein led to virus attenuation, manifested by minimal lung injury, limited neutrophil influx to the lungs, reduced expression of proinflammatory cytokines, increased anti-inflammatory cytokine levels, and enhanced CD4(+) and CD8(+) T cell counts in vivo, suggesting that these phenomena contribute to virus attenuation. The attenuated mutants fully protected mice from challenge with virulent virus. These studies show that mutations in the E protein are not well tolerated and indicate that this protein is an excellent target for vaccine development.
Copyright © 2015, American Society for Microbiology. All Rights Reserved.
Figures





Similar articles
-
Complete protection against severe acute respiratory syndrome coronavirus-mediated lethal respiratory disease in aged mice by immunization with a mouse-adapted virus lacking E protein.J Virol. 2013 Jun;87(12):6551-9. doi: 10.1128/JVI.00087-13. Epub 2013 Apr 10. J Virol. 2013. PMID: 23576515 Free PMC article.
-
Immunization with an attenuated severe acute respiratory syndrome coronavirus deleted in E protein protects against lethal respiratory disease.Virology. 2010 Mar 30;399(1):120-128. doi: 10.1016/j.virol.2010.01.004. Epub 2010 Jan 27. Virology. 2010. PMID: 20110095 Free PMC article.
-
Severe acute respiratory syndrome coronavirus envelope protein regulates cell stress response and apoptosis.PLoS Pathog. 2011 Oct;7(10):e1002315. doi: 10.1371/journal.ppat.1002315. Epub 2011 Oct 20. PLoS Pathog. 2011. PMID: 22028656 Free PMC article.
-
Coronavirus virulence genes with main focus on SARS-CoV envelope gene.Virus Res. 2014 Dec 19;194:124-37. doi: 10.1016/j.virusres.2014.07.024. Epub 2014 Aug 2. Virus Res. 2014. PMID: 25093995 Free PMC article. Review.
-
Molecular Basis of Coronavirus Virulence and Vaccine Development.Adv Virus Res. 2016;96:245-286. doi: 10.1016/bs.aivir.2016.08.003. Epub 2016 Aug 30. Adv Virus Res. 2016. PMID: 27712626 Free PMC article. Review.
Cited by
-
SARS-CoV-2: Insights into its structural intricacies and functional aspects for drug and vaccine development.Int J Biol Macromol. 2021 May 15;179:45-60. doi: 10.1016/j.ijbiomac.2021.02.212. Epub 2021 Mar 1. Int J Biol Macromol. 2021. PMID: 33662418 Free PMC article. Review.
-
Supramolecular Architecture of the Coronavirus Particle.Adv Virus Res. 2016;96:1-27. doi: 10.1016/bs.aivir.2016.08.005. Epub 2016 Sep 15. Adv Virus Res. 2016. PMID: 27712621 Free PMC article. Review.
-
The outbreak of SARS-CoV-2 pneumonia calls for viral vaccines.NPJ Vaccines. 2020 Mar 6;5(1):18. doi: 10.1038/s41541-020-0170-0. eCollection 2020. NPJ Vaccines. 2020. PMID: 32194995 Free PMC article.
-
Machine Learning, COVID-19 (2019-nCoV), and multi-OMICS.Cytometry A. 2020 Mar;97(3):215-216. doi: 10.1002/cyto.a.23990. Cytometry A. 2020. PMID: 32142596 Free PMC article. No abstract available.
-
Downregulated cytoplasmic polyadenylation element-binding protein-4 is associated with the carcinogenesis of head and neck squamous cell carcinoma.Oncol Lett. 2018 Mar;15(3):3226-3232. doi: 10.3892/ol.2017.7661. Epub 2017 Dec 20. Oncol Lett. 2018. PMID: 29435062 Free PMC article.
References
-
- Drosten C, Gunther S, Preiser W, van der Werf S, Brodt HR, Becker S, Rabenau H, Panning M, Kolesnikova L, Fouchier RA, Berger A, Burguiere AM, Cinatl J, Eickmann M, Escriou N, Grywna K, Kramme S, Manuguerra JC, Muller S, Rickerts V, Sturmer M, Vieth S, Klenk HD, Osterhaus AD, Schmitz H, Doerr HW. 2003. Identification of a novel coronavirus in patients with severe acute respiratory syndrome. N Engl J Med 348:1967–1976. doi:10.1056/NEJMoa030747. - DOI - PubMed
-
- Rota PA, Oberste MS, Monroe SS, Nix WA, Campganoli R, Icenogle JP, Peñaranda S, Bankamp B, Maher K, Chen M-H, Tong S, Tamin A, Lowe L, Frace M, DeRisi JL, Chen Q, Wang D, Erdman DD, Peret TC, Burns C, Ksiazek TG, Rollin PE, Sanchez A, Liffick S, Holloway B, Limor J, McCaustland K, Olsen-Rassmussen M, Fouchier R, Gunther S, Osterhaus AD, Drosten C, Pallansch MA, Anderson LJ, Bellini WJ. 2003. Characterization of a novel coronavirus associated with severe acute respiratory syndrome. Science 300:1394–1399. doi:10.1126/science.1085952. - DOI - PubMed
-
- Kuiken T, Fouchier RAM, Schutten M, Rimmelzwaan GF, van Amerongen G, van Riel D, Laman JD, de Jong T, van Doornum G, Lim W, Ling AE, Chan PKS, Tam JS, Zambon MC, Gopal R, Drosten C, van der Werf S, Escriou N, Manuguerra J-C, Stohr K, Peiris JSM. 2003. Newly discovered coronavirus as the primary cause of severe acute respiratory syndrome. Lancet 362:263–270. doi:10.1016/S0140-6736(03)13967-0. - DOI - PMC - PubMed
-
- Marra MA, Jones SJM, Astell CR, Holt RA, Brooks-Wilson A, Butterfield YSN, Khattra J, Asano JK, Barber SA, Chan SY, Cloutier A, Coughlin SM, Freeman D, Girn N, Griffith OL, Leach SR, Mayo M, McDonald H, Montgomery SB, Pandoh PK, Petrescu AS, Robertson AG, Schein JE, Siddiqui A, Smailus DE, Stott JM, Yang GS, Plummer F, Andonov A, Artsob H, Bastien N, Bernard K, Booth TF, Bowness D, Czub M, Drebot M, Fernando L, Flick R, Garbutt M, Gray M, Grolla A, Jones S, Feldmann H, Meyers A, Kabani A, Li Y, Normand S, Stroher U, Tipples GA, Tyler S, et al. . 2003. The genome sequence of the SARS-associated coronavirus. Science 300:1399–1404. doi:10.1126/science.1085953. - DOI - PubMed
Publication types
MeSH terms
Substances
Grants and funding
LinkOut - more resources
Full Text Sources
Other Literature Sources
Research Materials
Miscellaneous

