

Interleukin-1- and type I interferon-dependent enhanced immunogenicity of an NYVAC-HIV-1 Env-Gag-Pol-Nef vaccine vector with dual deletions of type I and type II interferon-binding proteins
- PMID: 25609807
- PMCID: PMC4403427
- DOI: 10.1128/JVI.03061-14
Interleukin-1- and type I interferon-dependent enhanced immunogenicity of an NYVAC-HIV-1 Env-Gag-Pol-Nef vaccine vector with dual deletions of type I and type II interferon-binding proteins
Abstract
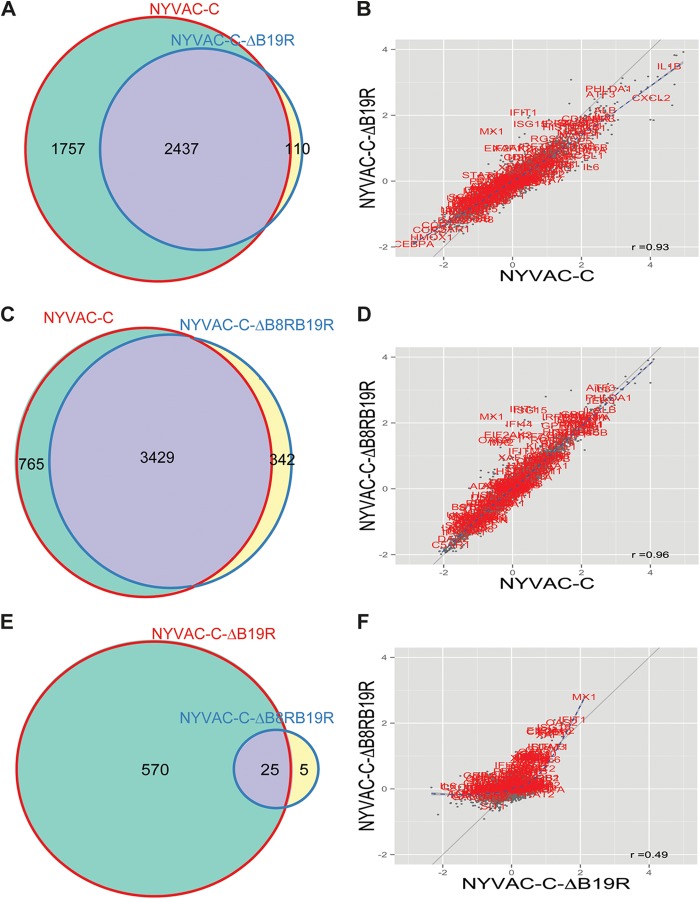
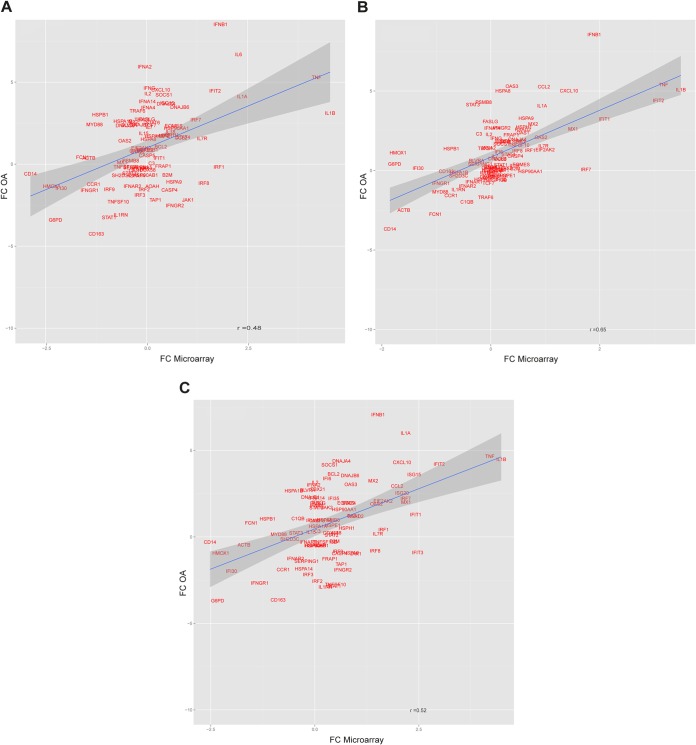
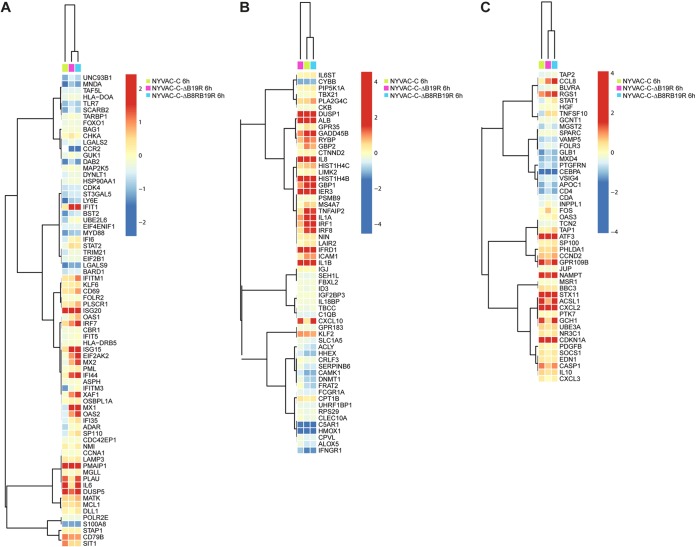
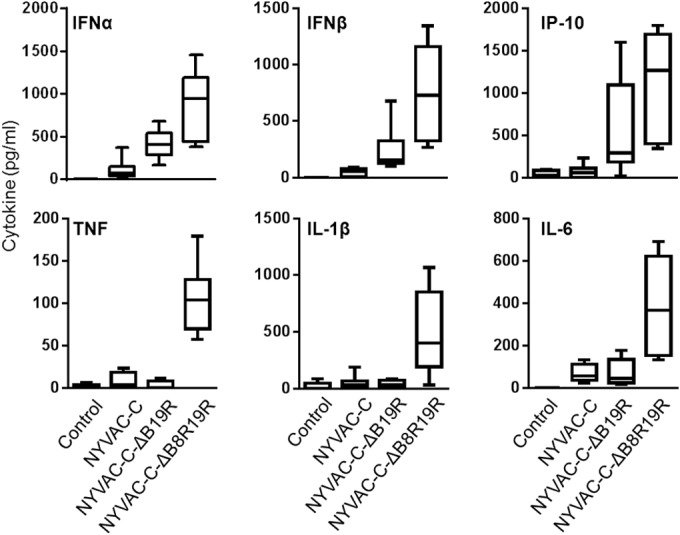
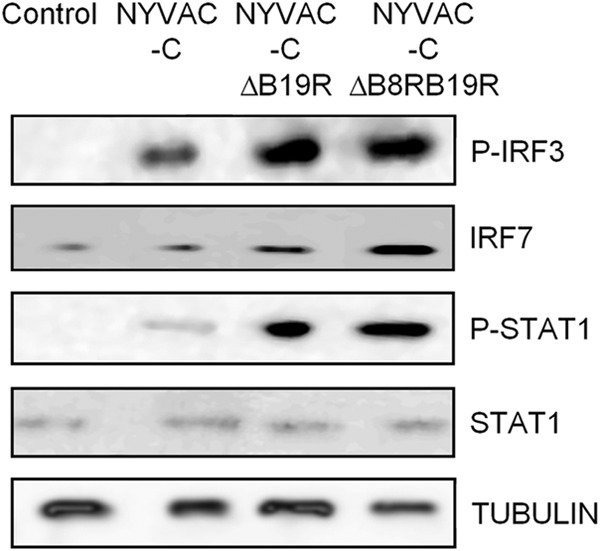
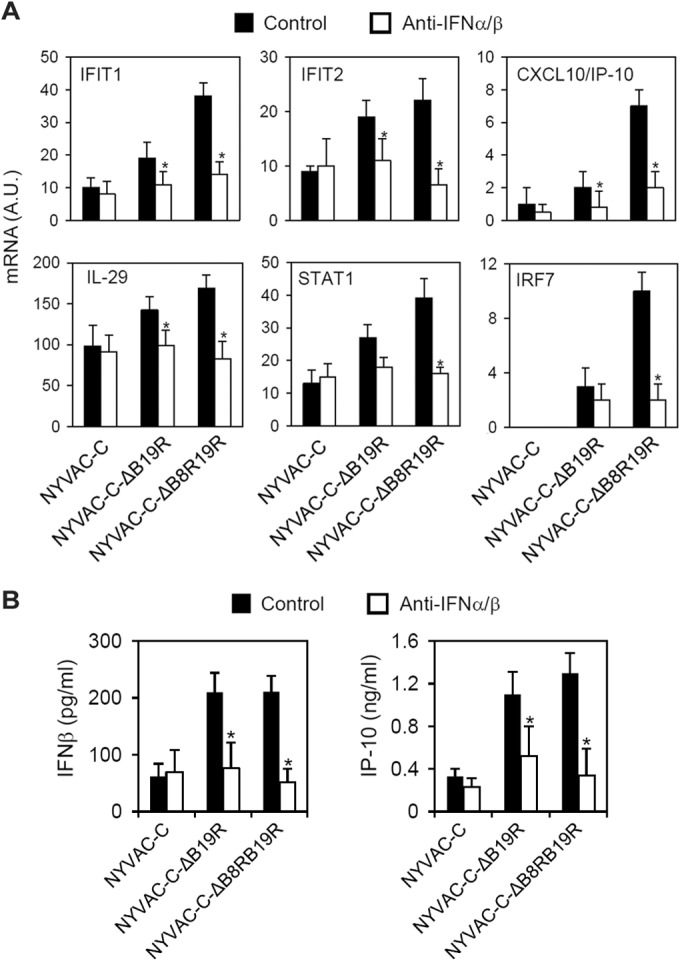
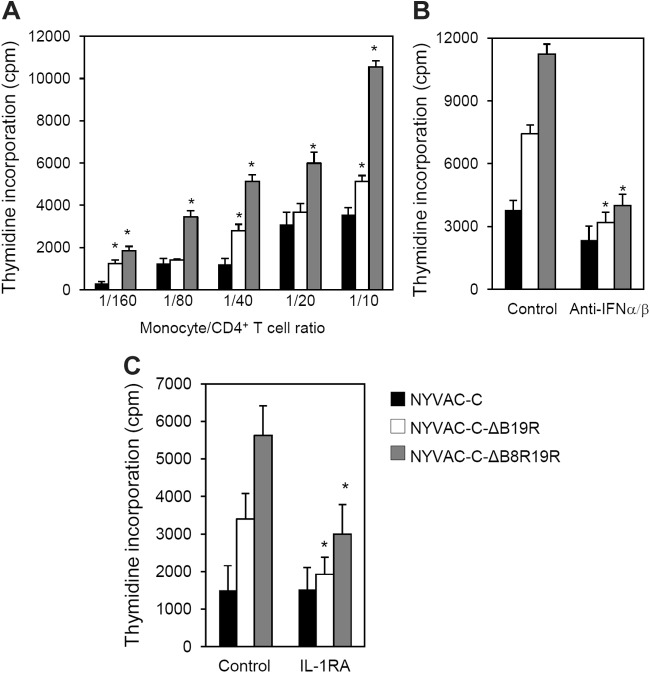
NYVAC, a highly attenuated, replication-restricted poxvirus, is a safe and immunogenic vaccine vector. Deletion of immune evasion genes from the poxvirus genome is an attractive strategy for improving the immunogenic properties of poxviruses. Using systems biology approaches, we describe herein the enhanced immunological profile of NYVAC vectors expressing the HIV-1 clade C env, gag, pol, and nef genes (NYVAC-C) with single or double deletions of genes encoding type I (ΔB19R) or type II (ΔB8R) interferon (IFN)-binding proteins. Transcriptomic analyses of human monocytes infected with NYVAC-C, NYVAC-C with the B19R deletion (NYVAC-C-ΔB19R), or NYVAC-C with B8R and B19R deletions (NYVAC-C-ΔB8RB19R) revealed a concerted upregulation of innate immune pathways (IFN-stimulated genes [ISGs]) of increasing magnitude with NYVAC-C-ΔB19R and NYVAC-C-ΔB8RB19R than with NYVAC-C. Deletion of B8R and B19R resulted in an enhanced activation of IRF3, IRF7, and STAT1 and the robust production of type I IFNs and of ISGs, whose expression was inhibited by anti-type I IFN antibodies. Interestingly, NYVAC-C-ΔB8RB19R induced the production of much higher levels of proinflammatory cytokines (tumor necrosis factor [TNF], interleukin-6 [IL-6], and IL-8) than NYVAC-C or NYVAC-C-ΔB19R as well as a strong inflammasome response (caspase-1 and IL-1β) in infected monocytes. Top network analyses showed that this broad response mediated by the deletion of B8R and B19R was organized around two upregulated gene expression nodes (TNF and IRF7). Consistent with these findings, monocytes infected with NYVAC-C-ΔB8RB19R induced a stronger type I IFN-dependent and IL-1-dependent allogeneic CD4(+) T cell response than monocytes infected with NYVAC-C or NYVAC-C-ΔB19R. Dual deletion of type I and type II IFN immune evasion genes in NYVAC markedly enhanced its immunogenic properties via its induction of the increased expression of type I IFNs and IL-1β and make it an attractive candidate HIV vaccine vector.
Importance: NYVAC is a replication-deficient poxvirus developed as a vaccine vector against HIV. NYVAC expresses several genes known to impair the host immune defenses by interfering with innate immune receptors, cytokines, or interferons. Given the crucial role played by interferons against viruses, we postulated that targeting the type I and type II decoy receptors used by poxvirus to subvert the host innate immune response would be an attractive approach to improve the immunogenicity of NYVAC vectors. Using systems biology approaches, we report that deletion of type I and type II IFN immune evasion genes in NYVAC poxvirus resulted in the robust expression of type I IFNs and interferon-stimulated genes (ISGs), a strong activation of the inflammasome, and upregulated expression of IL-1β and proinflammatory cytokines. Dual deletion of type I and type II IFN immune evasion genes in NYVAC poxvirus improves its immunogenic profile and makes it an attractive candidate HIV vaccine vector.
Copyright © 2015, American Society for Microbiology. All Rights Reserved.
Figures


Similar articles
-
HIV/AIDS Vaccine Candidates Based on Replication-Competent Recombinant Poxvirus NYVAC-C-KC Expressing Trimeric gp140 and Gag-Derived Virus-Like Particles or Lacking the Viral Molecule B19 That Inhibits Type I Interferon Activate Relevant HIV-1-Specific B and T Cell Immune Functions in Nonhuman Primates.J Virol. 2017 Apr 13;91(9):e02182-16. doi: 10.1128/JVI.02182-16. Print 2017 May 1. J Virol. 2017. PMID: 28179536 Free PMC article.
-
Removal of vaccinia virus genes that block interferon type I and II pathways improves adaptive and memory responses of the HIV/AIDS vaccine candidate NYVAC-C in mice.J Virol. 2012 May;86(9):5026-38. doi: 10.1128/JVI.06684-11. Epub 2012 Mar 14. J Virol. 2012. PMID: 22419805 Free PMC article.
-
Generation and immunogenicity of novel HIV/AIDS vaccine candidates targeting HIV-1 Env/Gag-Pol-Nef antigens of clade C.Vaccine. 2007 Mar 1;25(11):1969-92. doi: 10.1016/j.vaccine.2006.11.051. Epub 2006 Dec 6. Vaccine. 2007. PMID: 17224219
-
Identification and utility of innate immune system evasion mechanisms of ASFV.Virus Res. 2013 Apr;173(1):87-100. doi: 10.1016/j.virusres.2012.10.013. Epub 2012 Nov 16. Virus Res. 2013. PMID: 23165138 Review.
-
Poxvirus vectors as HIV/AIDS vaccines in humans.Hum Vaccin Immunother. 2012 Sep;8(9):1192-207. doi: 10.4161/hv.20778. Epub 2012 Aug 21. Hum Vaccin Immunother. 2012. PMID: 22906946 Free PMC article. Review.
Cited by
-
RNA-Seq Based Transcriptome Analysis of the Type I Interferon Host Response upon Vaccinia Virus Infection of Mouse Cells.J Immunol Res. 2017;2017:5157626. doi: 10.1155/2017/5157626. Epub 2017 Feb 9. J Immunol Res. 2017. PMID: 28280747 Free PMC article.
-
Deletion of A44L, A46R and C12L Vaccinia Virus Genes from the MVA Genome Improved the Vector Immunogenicity by Modifying the Innate Immune Response Generating Enhanced and Optimized Specific T-Cell Responses.Viruses. 2016 May 23;8(5):139. doi: 10.3390/v8050139. Viruses. 2016. PMID: 27223301 Free PMC article.
-
The transcription factor CREB1 is a mechanistic driver of immunogenicity and reduced HIV-1 acquisition following ALVAC vaccination.Nat Immunol. 2021 Oct;22(10):1294-1305. doi: 10.1038/s41590-021-01026-9. Epub 2021 Sep 23. Nat Immunol. 2021. PMID: 34556879 Free PMC article.
-
Blockade of beta adrenergic receptors protects the blood brain barrier and reduces systemic pathology caused by HIV-1 Nef protein.PLoS One. 2021 Nov 16;16(11):e0259446. doi: 10.1371/journal.pone.0259446. eCollection 2021. PLoS One. 2021. PMID: 34784367 Free PMC article.
-
HIV/AIDS Vaccine Candidates Based on Replication-Competent Recombinant Poxvirus NYVAC-C-KC Expressing Trimeric gp140 and Gag-Derived Virus-Like Particles or Lacking the Viral Molecule B19 That Inhibits Type I Interferon Activate Relevant HIV-1-Specific B and T Cell Immune Functions in Nonhuman Primates.J Virol. 2017 Apr 13;91(9):e02182-16. doi: 10.1128/JVI.02182-16. Print 2017 May 1. J Virol. 2017. PMID: 28179536 Free PMC article.
References
-
- Shiver JW, Fu TM, Chen L, Casimiro DR, Davies ME, Evans RK, Zhang ZQ, Simon AJ, Trigona WL, Dubey SA, Huang L, Harris VA, Long RS, Liang X, Handt L, Schleif WA, Zhu L, Freed DC, Persaud NV, Guan L, Punt KS, Tang A, Chen M, Wilson KA, Collins KB, Heidecker GJ, Fernandez VR, Perry HC, Joyce JG, Grimm KM, Cook JC, Keller PM, Kresock DS, Mach H, Troutman RD, Isopi LA, Williams DM, Xu Z, Bohannon KE, Volkin DB, Montefiori DC, Miura A, Krivulka GR, Lifton MA, Kuroda MJ, Schmitz JE, Letvin NL, Caulfield MJ, Bett AJ, Youil R, Kaslow DC, Emini EA. 2002. Replication-incompetent adenoviral vaccine vector elicits effective anti-immunodeficiency-virus immunity. Nature 415:331–335. doi:10.1038/415331a. - DOI - PubMed
-
- Buchbinder SP, Mehrotra DV, Duerr A, Fitzgerald DW, Mogg R, Li D, Gilbert PB, Lama JR, Marmor M, Del Rio C, McElrath MJ, Casimiro DR, Gottesdiener KM, Chodakewitz JA, Corey L, Robertson MN, Step Study Protocol Team . 2008. Efficacy assessment of a cell-mediated immunity HIV-1 vaccine (the Step Study): a double-blind, randomised, placebo-controlled, test-of-concept trial. Lancet 372:1881–1893. doi:10.1016/S0140-6736(08)61591-3. - DOI - PMC - PubMed
Publication types
MeSH terms
Substances
LinkOut - more resources
Full Text Sources
Molecular Biology Databases
Research Materials
Miscellaneous
