

Nedd4 haploinsufficient mice display moderate insulin resistance, enhanced lipolysis, and protection against high-fat diet-induced obesity
- PMID: 25607895
- PMCID: PMC4399314
- DOI: 10.1210/en.2014-1909
Nedd4 haploinsufficient mice display moderate insulin resistance, enhanced lipolysis, and protection against high-fat diet-induced obesity
Abstract
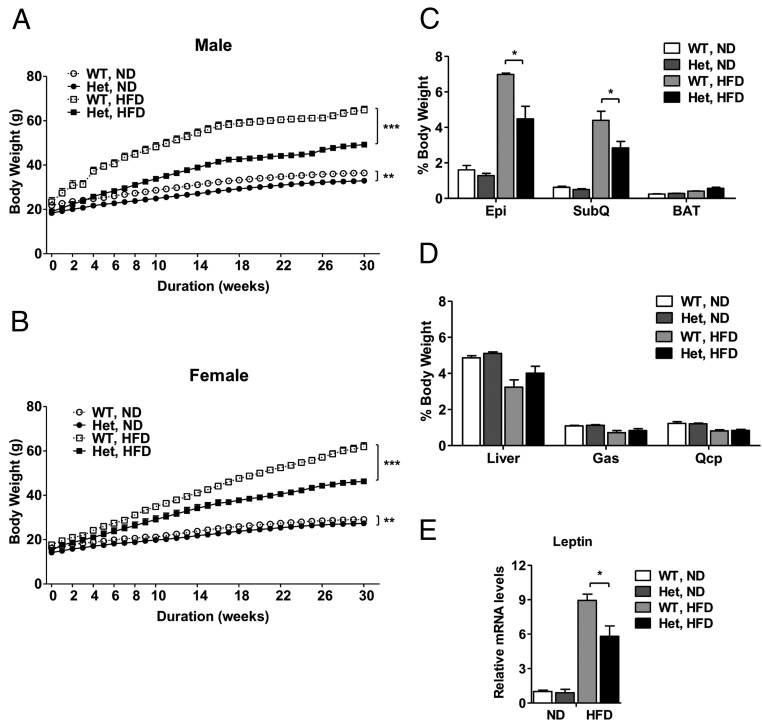
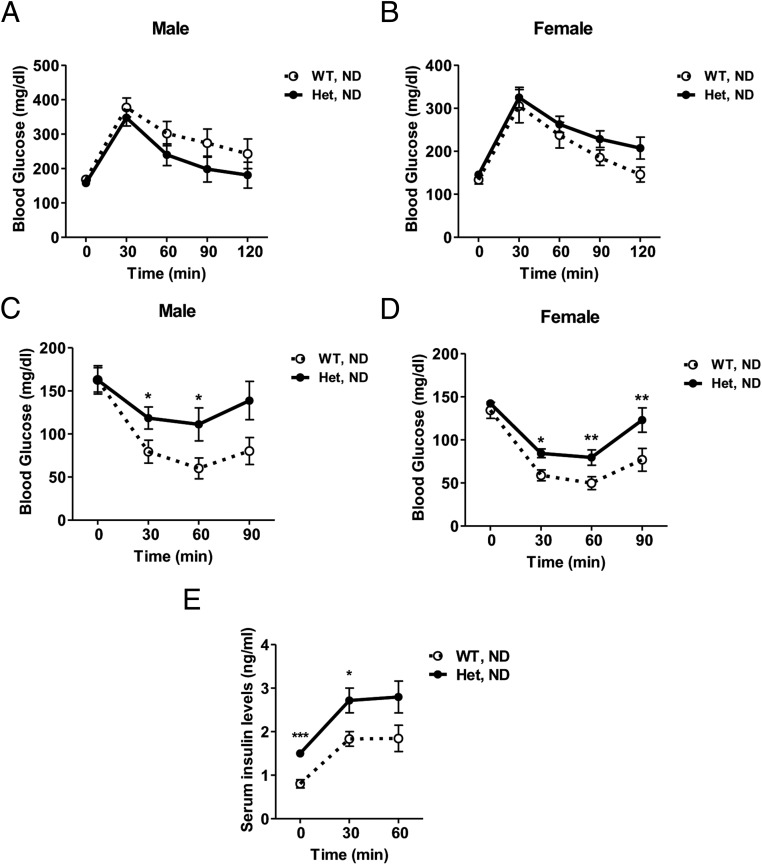
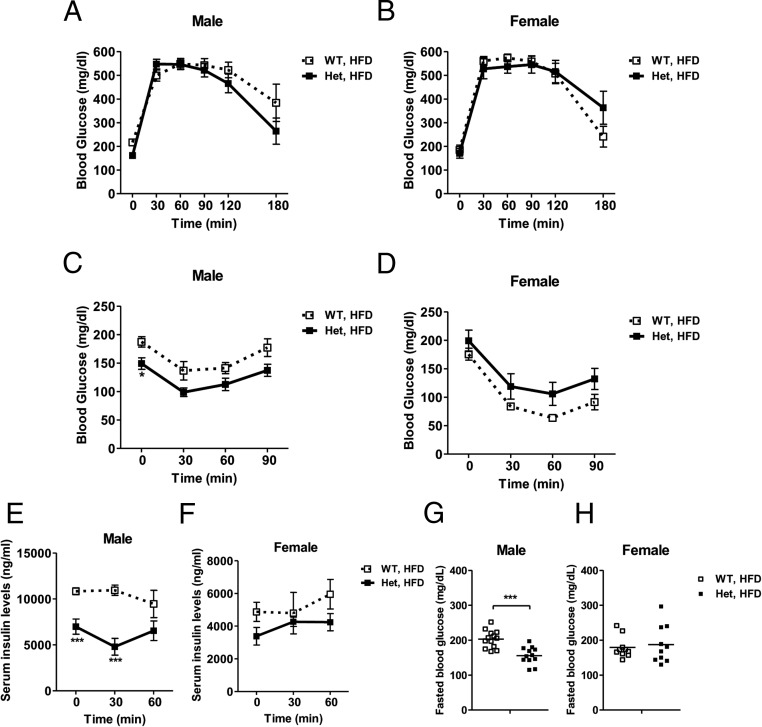
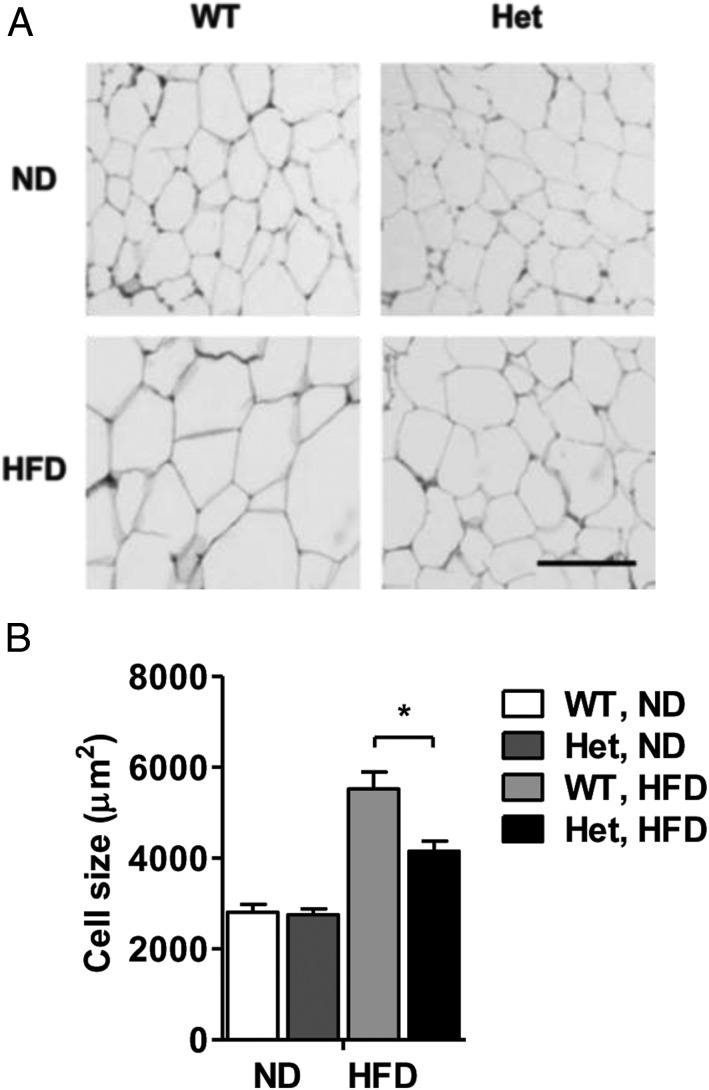
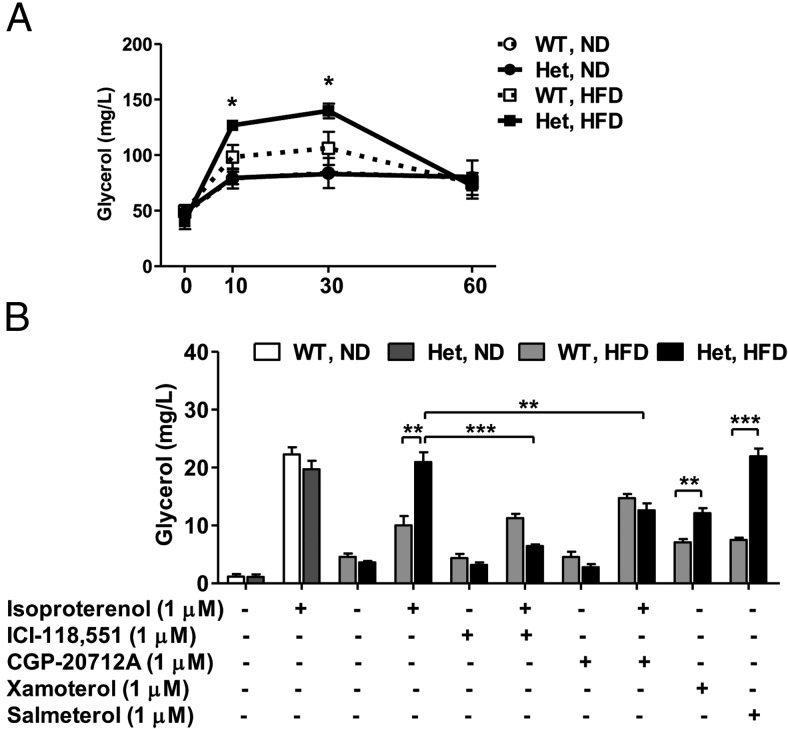
Neural precursor cell expressed developmentally down-regulated protein 4 (Nedd4) is the prototypical protein in the Nedd4 ubiquitin ligase (E3) family, which governs ubiquitin-dependent endocytosis and/or degradation of plasma membrane proteins. Loss of Nedd4 results in embryonic or neonatal lethality in mice and reduced insulin/IGF-1 signaling in embryonic fibroblasts. To delineate the roles of Nedd4 in vivo, we examined the phenotypes of heterozygous knockout mice using a high-fat diet-induced obesity (HFDIO) model. We observed that Nedd4+/- mice are moderately insulin resistant but paradoxically protected against HFDIO. After high-fat diet feeding, Nedd4+/- mice showed less body weight gain, less fat mass, and smaller adipocytes vs the wild type. Despite ameliorated HFDIO, Nedd4+/- mice did not manifest improvement in glucose tolerance vs the wild type in both genders. Nedd4+/- male, but not female, mice displayed significantly lower fasting blood glucose levels and serum insulin levels. Under obesogenic conditions, Nedd4+/- mice displayed elevated stimulated lipolytic activity, primarily through a β2-adrenergic receptor. Combined, these data support novel complex roles for Nedd4 in metabolic regulation involving altered insulin and β-adrenergic signaling pathways.
Figures


Similar articles
-
Mammalian α arrestins link activated seven transmembrane receptors to Nedd4 family e3 ubiquitin ligases and interact with β arrestins.PLoS One. 2012;7(12):e50557. doi: 10.1371/journal.pone.0050557. Epub 2012 Dec 7. PLoS One. 2012. PMID: 23236378 Free PMC article.
-
The ubiquitin ligase Siah2 regulates obesity-induced adipose tissue inflammation.Obesity (Silver Spring). 2015 Nov;23(11):2223-32. doi: 10.1002/oby.21220. Epub 2015 Sep 18. Obesity (Silver Spring). 2015. PMID: 26380945 Free PMC article.
-
Lack of CUL4B in Adipocytes Promotes PPARγ-Mediated Adipose Tissue Expansion and Insulin Sensitivity.Diabetes. 2017 Feb;66(2):300-313. doi: 10.2337/db16-0743. Epub 2016 Nov 29. Diabetes. 2017. PMID: 27899484
-
Nedd4 and Nedd4-2: ubiquitin ligases at work in the neuron.Int J Biochem Cell Biol. 2013 Mar;45(3):706-10. doi: 10.1016/j.biocel.2012.12.006. Epub 2012 Dec 20. Int J Biochem Cell Biol. 2013. PMID: 23262292 Review.
-
Insulin translates unfavourable lifestyle into obesity.BMC Med. 2018 Dec 13;16(1):232. doi: 10.1186/s12916-018-1225-1. BMC Med. 2018. PMID: 30541568 Free PMC article. Review.
Cited by
-
Systems genetic analysis of brown adipose tissue function.Physiol Genomics. 2018 Jan 1;50(1):52-66. doi: 10.1152/physiolgenomics.00091.2017. Epub 2017 Nov 10. Physiol Genomics. 2018. PMID: 29127223 Free PMC article.
-
Covalent Tethering of Fragments For Covalent Probe Discovery.Medchemcomm. 2016 Apr 1;7(4):576-585. doi: 10.1039/c5md00518c. Epub 2016 Jan 28. Medchemcomm. 2016. PMID: 27398190 Free PMC article.
-
A Small Molecule That Switches a Ubiquitin Ligase From a Processive to a Distributive Enzymatic Mechanism.J Am Chem Soc. 2015 Oct 7;137(39):12442-5. doi: 10.1021/jacs.5b06839. Epub 2015 Sep 22. J Am Chem Soc. 2015. PMID: 26371805 Free PMC article.
-
Polyphenols alleviate metabolic disorders: the role of ubiquitin-proteasome system.Front Nutr. 2024 Aug 12;11:1445080. doi: 10.3389/fnut.2024.1445080. eCollection 2024. Front Nutr. 2024. PMID: 39188976 Free PMC article. Review.
-
Ubiquitin Ligases Involved in the Regulation of Wnt, TGF-β, and Notch Signaling Pathways and Their Roles in Mouse Development and Homeostasis.Genes (Basel). 2019 Oct 16;10(10):815. doi: 10.3390/genes10100815. Genes (Basel). 2019. PMID: 31623112 Free PMC article. Review.
References
-
- Kopelman PG. Obesity as a medical problem. Nature. 2000;404:635–643. - PubMed
-
- Sun Y. Targeting E3 ubiquitin ligases for cancer therapy. Cancer Biol Ther. 2003;2:623–629. - PubMed
-
- Ardley HC, Robinson PA. The role of ubiquitin-protein ligases in neurodegenerative disease. Neurodegener Dis. 2004;1:71–87. - PubMed
-
- Song R, Peng W, Zhang Y, et al. Central role of E3 ubiquitin ligase MG53 in insulin resistance and metabolic disorders. Nature. 2013;494:375–379. - PubMed
Publication types
MeSH terms
Substances
Grants and funding
LinkOut - more resources
Full Text Sources
Other Literature Sources
Medical
