Quantifying heterogeneity and dynamics of clonal fitness in response to perturbation
- PMID: 25600161
- PMCID: PMC5580929
- DOI: 10.1002/jcp.24888
Quantifying heterogeneity and dynamics of clonal fitness in response to perturbation
Abstract
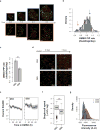
The dynamics of heterogeneous clonal lineages within a cell population, in aggregate, shape both normal and pathological biological processes. Studies of clonality typically relate the fitness of clones to their relative abundance, thus requiring long-term experiments and limiting conclusions about the heterogeneity of clonal fitness in response to perturbation. We present, for the first time, a method that enables a dynamic, global picture of clonal fitness within a mammalian cell population. This novel assay allows facile comparison of the structure of clonal fitness in a cell population across many perturbations. By utilizing high-throughput imaging, our methodology provides ample statistical power to define clonal fitness dynamically and to visualize the structure of perturbation-induced clonal fitness within a cell population. We envision that this technique will be a powerful tool to investigate heterogeneity in biological processes involving cell proliferation, including development and drug response.
© 2015 Wiley Periodicals, Inc.
Figures
Similar articles
-
CloneSifter: enrichment of rare clones from heterogeneous cell populations.BMC Biol. 2020 Nov 24;18(1):177. doi: 10.1186/s12915-020-00911-3. BMC Biol. 2020. PMID: 33234154 Free PMC article.
-
Using picoliter droplet deposition to track clonal competition in adherent and organoid cancer cell cultures.Sci Rep. 2023 Nov 1;13(1):18832. doi: 10.1038/s41598-023-42849-w. Sci Rep. 2023. PMID: 37914743 Free PMC article.
-
Non-genetic determinants of malignant clonal fitness at single-cell resolution.Nature. 2022 Jan;601(7891):125-131. doi: 10.1038/s41586-021-04206-7. Epub 2021 Dec 8. Nature. 2022. PMID: 34880496
-
Quantitative Clinical Imaging Methods for Monitoring Intratumoral Evolution.Methods Mol Biol. 2017;1513:61-81. doi: 10.1007/978-1-4939-6539-7_6. Methods Mol Biol. 2017. PMID: 27807831 Review.
-
Clonal interactions in cancer: Integrating quantitative models with experimental and clinical data.Semin Cancer Biol. 2023 Jul;92:61-73. doi: 10.1016/j.semcancer.2023.04.002. Epub 2023 Apr 5. Semin Cancer Biol. 2023. PMID: 37023969 Review.
Cited by
-
An in vitro model of tumor heterogeneity resolves genetic, epigenetic, and stochastic sources of cell state variability.PLoS Biol. 2021 Jun 1;19(6):e3000797. doi: 10.1371/journal.pbio.3000797. eCollection 2021 Jun. PLoS Biol. 2021. PMID: 34061819 Free PMC article.
-
Microfluidic Compartmentalization Platforms for Single Cell Analysis.Biosensors (Basel). 2022 Jan 21;12(2):58. doi: 10.3390/bios12020058. Biosensors (Basel). 2022. PMID: 35200319 Free PMC article. Review.
-
A Nonquiescent "Idling" Population State in Drug-Treated, BRAF-Mutated Melanoma.Biophys J. 2018 Mar 27;114(6):1499-1511. doi: 10.1016/j.bpj.2018.01.016. Biophys J. 2018. PMID: 29590606 Free PMC article.
-
Quantifying cancer cell plasticity with gene regulatory networks and single-cell dynamics.Front Netw Physiol. 2023 Sep 4;3:1225736. doi: 10.3389/fnetp.2023.1225736. eCollection 2023. Front Netw Physiol. 2023. PMID: 37731743 Free PMC article. Review.
-
Real-time luminescence enables continuous drug-response analysis in adherent and suspension cell lines.Cancer Biol Ther. 2022 Dec 31;23(1):358-368. doi: 10.1080/15384047.2022.2065182. Cancer Biol Ther. 2022. PMID: 35443861 Free PMC article.
References
-
- Anderson AR, Weaver AM, Cummings PT, Quaranta V. Tumor Morphology and Phenotypic Evolution Driven by Selective Pressure from the Microenvironment. Cell. 2006;127:905–915. - PubMed
-
- Azzalini A. The Skew-normal Distribution and Related Multivariate Families*. Scand J Stat. 2005;32:159–188.
-
- Balaban NQ, Merrin J, Chait R, Kowalik L, Leibler S. Bacterial persistence as a phenotypic switch. Science. 2004;305:1622–1625. - PubMed
Publication types
MeSH terms
Substances
Grants and funding
LinkOut - more resources
Full Text Sources
Other Literature Sources

