. 2015 Jan 16:5:7827.
doi: 10.1038/srep07827.

Essential roles of leucine-rich glioma inactivated 1 in the development of embryonic and postnatal cerebellum

Affiliations

Essential roles of leucine-rich glioma inactivated 1 in the development of embryonic and postnatal cerebellum

Ya-Jun Xie et al. Sci Rep. .

Abstract

Leucine-rich glioma inactivated 1 (LGI1) is a secreted protein that interacts with ADAM transmembrane proteins, and its mutations are linked to human epilepsy. The function of LGI1 in CNS development remains undefined. Here, we report novel functions of LGI1 in the generation of cerebellar granule precursors (CGPs) and differentiation of radial glial cells (RGCs) in the cerebellum. A reduction in external granule layer thickness and defects in foliation were seen in embryonic and new-born LGI1 knockout (KO) mice. BrdU staining showed an inhibited proliferation of CGPs in KO embryos, which might be explained by the reduced Sonic hedgehog in embryos. In addition, the differentiation of RGCs into Bergmann glias was suppressed in KO mice. Enhanced Jagged1-Notch1 signaling in KO mice via reduced β-secretase proteolysis suggests that altered phenotype of RGCs is due to abnormal Notch1 signaling. Together, our results demonstrate that LGI1 is an essential player in the cerebellar development.


Figures
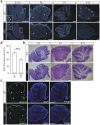
Figure 1
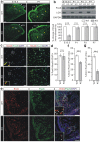
Figure 1. Abnormal foliation in the KO cerebellum.
(a) Mid-sagittal sections of E15.5, P0, P7, and P14 cerebella derived from WT and KO littermates were stained with DAPI. Higher magnifications show segments of the EGL (boxes in E15.5 panels). The dashed lines show the interior edge of EGL. Note that the EGL thickness was reduced in KO cerebella (white arrowheads). At P0, the WT cerebellum had developed 7 lobes, but the KO cerebellum displayed only 5 (white arrowheads). No folia defects were found in P7 and P14 KO littermates. Roman numerals denote cerebellar lobules for both WT and KO cerebella. n = 7 pairs for P0, P7, or P14. Scale bars: 200 μm. (a') The thickness of the EGL at E15.5 was 30.1 ± 1.0 μm (WT) or 20.0 ± 0.8 μm (KO). n = 6 pairs, *** p < 0.001 (p = 0.0003, two-sided Student's t-test). (b) H&E staining of mid-sagittal sections from P0, P7, and P14 cerebella. KO cerebella (P0) showed marked agenesis of foliation (arrowheads), which was mostly corrected in P7 and P14 cerebella. Missing fissures were sometimes observed in P7 cerebella (arrowhead in the middle panel). n = 5 pairs for each age. Scale bars: 200 μm. (c) P0 cerebella stained with DAPI and with laminin-1 (laminin). While the foliation deficit was evident in the KO mice (arrowheads in left panels), laminin-1 staining was intact and continuous along the cerebellar surface (n = 5 pairs). Scale bars: 200 μm.
Figure 2
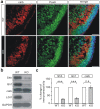
Figure 2. Nestin expression is normal in the KO mice.
(a) Nestin staining in the cerebellum (E15.5) and cerebellar lobules (P1). Arrowheads indicate abnormal EGL thickness and folia formation (n = 7 pairs for each age). Scale bars: 50 μm. (b) Total nestin expression levels were measured by western blotting using GAPDH as the internal control. (c) Quantitation of nestin immunoreactivity. The nestin/GAPDH ratios were 61.7 ± 8.0% (WT, E15.5) and 60.6 ± 6.9% (KO, E15.5) (n = 3, p = 0.34); 62.6 ± 8.0% (WT, P1) and 64.1 ± 7.2% (KO, P1) (n = 3, p = 0.17). Statistical analysis was done by two-sided Student's t-test. n.s.: no significance.
Figure 3
Figure 3. CGP proliferation is reduced in KO mice.
(a) Mid-sagittal sections of cerebella stained for Pax6. White and yellow arrowheads indicate Pax6 staining in the EGL and IGL, respectively. Pax6 intensity was reduced at E15.5 (n = 8 pairs), but unchanged at P1 (n = 7 pairs). Scale bars: 50 μm. (b) Total Pax6 expression was measured at E15.5, P1, P3, and P7, using GAPDH as the loading control. The percentage changes of Pax6 (KO/WT) were 36.3 ± 7.9% (E15.5; n = 5 pairs, p = 0.00021), 92.8 ± 9.9% (P1; n = 4 pairs, p = 0.35); 101.7 ± 6.9% (P3; n = 4 pairs, p = 0.32); 99.7 ± 8.9% (P7; n = 4 pairs, p = 0.43). Statistical analysis was done by one-sided Student's t-test. *** p < 0.001. n.s.: no significance. (c) Left panels show the staining of NeuN (red), Pax6 (green), and DAPI (blue) in cultured granule cells (DIV12). Higher magnification in white boxes, where the DAPI signal was removed, shows cells double-stained with NeuN and Pax6, indicating that 100% of NeuN-positive cells were Pax6-positive. Right panels: DIV12 granule cells labeled with TuJ1 (green) and NeuN (red). Nuclei were counterstained with DAPI (blue). Immunoreactivity for TuJ1 displayed long processes from differentiated neurons in both groups. Scale bars: 50 μm. (d) Numbers of NeuN+Pax6+ cells in cultured granule cells (DIV12) expressed as percentages of DAPI+stained cells (WT: 46.3 ± 2.8%; KO: 44.5 ± 5.5%; n = 6 pairs) Two-sided Student's t-test. p = 0.34. n.s.: no significance. (e) Mid-sagittal sections of P0 cerebella were stained with Pax6, BrdU, and DAPI. Dashed lines define the EGL. Higher magnifications in the white boxes, with the DAPI signal removed, show cells stained by BrdU and Pax6 (arrowheads). Scale bars: 50 μm. (f) Percentages of BrdU+Pax6+ cells/Pax6+ cells in a lobe. n = 5, *** p < 0.001 (p = 0.00012, two-sided Student's t-test). (g) Percentages of BrdU+Pax6+ cells/Pax6+ cells within the EGL. n = 5, * p < 0.001 (p = 0.00018, two-sided Student's t-test).
Figure 4
Figure 4. LGI1-deficiency correlates with reduced expression of Shh in vivo.
(a) Mid-sagittal sections of P1 cerebella stained for calbindin (calb) and Pax6. Note that calbindin labeling was seen in the inner layer whereas the majority of the Pax6 signal was in the outermost layer. Calbindin staining was grossly normal in the KO cerebellum (n = 7 pairs). Scale bars: 50 μm. (b) Total expression of Shh and Gli1 was decreased in the E15.5 KO cerebellum, but calbindin (calb) was not affected. GAPDH was the internal control. (c) The percentage changes of signal intensity (KO/WT) were 26.3 ± 7.9% (Shh; p = 0.0006), 31.7 ± 9.3% (Gli1; p = 0.0008), and 98.1 ± 16.3% (calb; p = 0.24). Experiments were performed on 5 pairs of littermates. Statistical analysis was done by one-sided Student's t-test. *** p < 0.001. n.s.: no significance.
Figure 5
Figure 5. Loss of LGI1 results in reduced differentiation of RGCs.
(a) Mid-sagittal sections of P1 cerebella stained for BLBP and GFAP. White and yellow arrowheads indicate the fluorescence in the interior area and EGL respectively, showing that BLBP expression was increased whereas GFAP expression was reduced in the KO mice (n = 5 pairs). Scale bars: 50 μm. (b) Mid-sagittal sections of P7 cerebella stained for BLBP and GFAP. White and yellow arrowheads indicate the fluorescence in the white matter area and BG cell bodies, respectively (n = 5 pairs). Scale bars: 50 μm. (c) Total expression of BLBP and GFAP was measured in WT and KO littermates at P1 and P7 using GAPDH as the internal control. Lower panel: the percentage changes of BLBP and GFAP signal intensity (KO vs WT) were 157.5 ± 21.2% (P1, BLBP; p = 0.044), 195.8 ± 29.8% (P7, BLBP; p = 0.028), 47.6 ± 12.2% (P1, GFAP; p = 0.0087), and 42.7 ± 10.8% (P7, GFAP; p = 0.0075). Experiments were performed on 6 pairs of littermates. Statistical analysis was done by one-sided Student's t-test. ** p < 0.01. * p < 0.05. (d) Dentate gyrus of P14 hippocampus stained for BLBP. Arrowheads indicate the fluorescence intensity of BLBP in WT and KO mice (n = 3 pairs). Scale bars: 50 μm.
Figure 6
Figure 6. Gliogenesis is decreased in cultured KO RGCs.
(a) Cultured RGCs (DIV12) identified by their bipolar morphology and BLBP immunoreactivity. Arrowheads indicate cells double-stained with BLBP and GFAP. Scale bars: 50 μm. (b) KO cultures displayed a decrease in the ratio of GFAP+BLBP+ cells to BLBP+ cells. The percentages were 82.9 ± 3.4% (WT) and 56.2 ± 4.5% (KO), n = 7, * p < 0.05 (p = 0.027, two-sided Student's t-test). (c) RGC cultures (DIV12) maintained in medium supplemented with either serum or 10 ng/ml TGF-β1 and stained with nestin and GFAP. Arrowheads indicate nestin+GFAP+ cells. Scale bars: 50 μm. (d) Percentages of each cell type from experiments as in (c).
Figure 7
Figure 7. Jagged1-Notch1 signaling is enhanced in KO mice.
(a) Expressions of NICD and BLBP in the KO cerebella were increased at P1 and P14. The percentage changes (KO/WT) were 131.8 ± 10.9% (NICD, P1; p = 0.034), 125.3 ± 10.7% (NICD, P14; p = 0.033), 131.4 ± 6.3% (BLBP, P1; p = 0.013), and 129.4 ± 3.5% (BLBP, P14; p = 0.0055). Experiments were performed on 7 pairs of littermates. Statistical analysis was done by one-sided Student's t-test. ** p < 0.01. * p < 0.05. (b) NICD expression in the membrane fraction was increased in the P14 KO cerebellum. Flotillin-1 was used as the internal control. The percentage change (KO/WT) was 126.5 ± 7.1%, n = 7, * p < 0.05 (p = 0.013, one-sided Student's t-test). (c) Protein levels of NICD and BLBP were increased in KO RGC cultures. The percentage changes (KO/WT) were 131.0 ± 11.7% (NICD; p = 0.026) and 126.4 ± 7.0% (BLBP; p = 0.0094). Experiments were performed on 7 pairs of littermates. Statistical analysis was done by one-sided Student's t-test. ** p < 0.01. * p < 0.05. (d) The amount of full-length Jagged1 (Jag1-Fl) were increased, while BACE1 and Jag1-Ctf were decreased, at P3 in KO mice. The percentage changes (KO/WT) were 52.5 ± 7.8% (BACE1; p = 0.0076), 125.3 ± 8.8% (Jag1-Fl; p = 0.023), and 67.2 ± 8.9% (Jag1-Ctf; p = 0.015). Experiments were performed on 4 pairs of littermates. Statistical analysis was done by one-sided Student's t-test. ** p < 0.01. * p < 0.05.

Similar articles

Cited by

References

    1. Kalachikov S. et al. Mutations in LGI1 cause autosomal-dominant partial epilepsy with auditory features. Nat. Genet. 30, 335–341 (2002). - PMC - PubMed
    1. Gu W., Brodtkorb E. & Steinlein O. K. LGI1 is mutated in familial temporal lobe epilepsy characterized by aphasic seizures. Ann. Neurol. 52, 364–367 (2002). - PubMed
    1. Senechal K. R., Thaller C. & Noebels J. L. ADPEAF mutations reduce levels of secreted LGI1, a putative tumor suppressor protein linked to epilepsy. Hum. Mol. Genet. 14, 1613–1620 (2005). - PubMed
    1. Kegel L., Aunin E., Meijer D. & Bermingham J. R. LGI proteins in the nervous system. ASN Neuro. 5, 167–181 (2013). - PMC - PubMed
    1. Fukata Y. et al. Epilepsy-related ligand/receptor complex LGI1 and ADAM22 regulate synaptic transmission. Science 313, 1792–1795 (2006). - PubMed

Publication types