LPS exacerbates functional and inflammatory responses to ovalbumin and decreases sensitivity to inhaled fluticasone propionate in a guinea pig model of asthma
- PMID: 25586266
- PMCID: PMC4409909
- DOI: 10.1111/bph.13080
LPS exacerbates functional and inflammatory responses to ovalbumin and decreases sensitivity to inhaled fluticasone propionate in a guinea pig model of asthma
Abstract
Background and purpose: Asthma exacerbations contribute to corticosteroid insensitivity. LPS is ubiquitous in the environment. It causes bronchoconstriction and airway inflammation and may therefore exacerbate allergen responses. This study examined whether LPS and ovalbumin co-administration could exacerbate the airway inflammatory and functional responses to ovalbumin in conscious guinea pigs and whether these exacerbated responses were insensitive to inhaled corticosteroid treatment with fluticasone propionate (FP).
Experimental approach: Guinea pigs were sensitized and challenged with ovalbumin and airway function recorded as specific airway conductance by whole body plethysmography. Airway inflammation was measured from lung histology and bronchoalveolar lavage. Airway hyper-reactivity (AHR) to inhaled histamine was examined 24 h after ovalbumin. LPS was inhaled alone or 24 or 48 h before ovalbumin and combined with ovalbumin. FP (0.05-1 mg·mL(-1) ) or vehicle was nebulized for 15 min twice daily for 6 days before ovalbumin or LPS exposure.
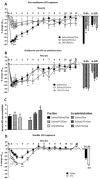
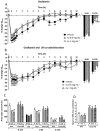
Key results: Ovalbumin inhalation caused early (EAR) and late asthmatic response (LAR), airway hyper-reactivity to histamine and influx of inflammatory cells into the lungs. LPS 48 h before and co-administered with ovalbumin exacerbated the response with increased length of the EAR, prolonged response to histamine and elevated inflammatory cells. FP 0.5 and 1 mg·mL(-1) reduced the LAR, AHR and cell influx with ovalbumin alone, but was ineffective when guinea pigs were exposed to LPS before and with ovalbumin.
Conclusions and implications: LPS exposure exacerbates airway inflammatory and functional responses to allergen inhalation and decreases corticosteroid sensitivity. Its widespread presence in the environment could contribute to asthma exacerbations and corticosteroid insensitivity in humans.
© 2015 The Authors. British Journal of Pharmacology published by John Wiley & Sons Ltd on behalf of The British Pharmacological Society.
Figures


Similar articles
-
Route of Administration Affects Corticosteroid Sensitivity of a Combined Ovalbumin and Lipopolysaccharide Model of Asthma Exacerbation in Guinea Pigs.J Pharmacol Exp Ther. 2017 Aug;362(2):327-337. doi: 10.1124/jpet.117.241927. Epub 2017 Jun 2. J Pharmacol Exp Ther. 2017. PMID: 28576975 Free PMC article.
-
A comparison of antiasthma drugs between acute and chronic ovalbumin-challenged guinea-pig models of asthma.Pulm Pharmacol Ther. 2012 Dec;25(6):453-64. doi: 10.1016/j.pupt.2012.08.004. Epub 2012 Aug 23. Pulm Pharmacol Ther. 2012. PMID: 23046662
-
Early- and late-phase bronchoconstriction, airway hyper-reactivity and cell influx into the lungs, after 5'-adenosine monophosphate inhalation: comparison with ovalbumin.Clin Exp Allergy. 2005 Apr;35(4):522-30. doi: 10.1111/j.1365-2222.2005.02211.x. Clin Exp Allergy. 2005. PMID: 15836763
-
Techniques for drug delivery to the airways, and the assessment of lung function in animal models.J Pharmacol Toxicol Methods. 1992 May;27(3):143-59. doi: 10.1016/1056-8719(92)90035-y. J Pharmacol Toxicol Methods. 1992. PMID: 1498342 Review.
-
Pulmonary responses of the guinea pig to inhaled A23187: a brief review.Agents Actions. 1992 Nov;37(3-4):188-90. doi: 10.1007/BF02028105. Agents Actions. 1992. PMID: 1295367 Review.
Cited by
-
Effects of Anti-IL-17 on Inflammation, Remodeling, and Oxidative Stress in an Experimental Model of Asthma Exacerbated by LPS.Front Immunol. 2018 Jan 5;8:1835. doi: 10.3389/fimmu.2017.01835. eCollection 2017. Front Immunol. 2018. PMID: 29379497 Free PMC article.
-
Isoorientin ameliorates OVA-induced asthma in a murine model of asthma.Exp Biol Med (Maywood). 2022 Aug;247(16):1479-1488. doi: 10.1177/15353702221094505. Epub 2022 Jun 6. Exp Biol Med (Maywood). 2022. PMID: 35658632 Free PMC article.
-
Endotoxin Is Inactivated by Ethylene Oxide, Gamma, Electron Beam, and Steam Sterilization.Biomed Instrum Technol. 2023;57(3):98-105. doi: 10.2345/0899-8205-57.3.98. Epub 2023 Aug 25. Biomed Instrum Technol. 2023. PMID: 37624937 Free PMC article.
-
Neutrophil activation and NETosis are the predominant drivers of airway inflammation in an OVA/CFA/LPS induced murine model.Respir Res. 2022 Oct 21;23(1):289. doi: 10.1186/s12931-022-02209-0. Respir Res. 2022. PMID: 36271366 Free PMC article.
-
The Interactive Roles of Lipopolysaccharides and dsRNA/Viruses on Respiratory Epithelial Cells and Dendritic Cells in Allergic Respiratory Disorders: The Hygiene Hypothesis.Int J Mol Sci. 2017 Oct 23;18(10):2219. doi: 10.3390/ijms18102219. Int J Mol Sci. 2017. PMID: 29065558 Free PMC article. Review.
References
Publication types
MeSH terms
Substances
LinkOut - more resources
Full Text Sources
Other Literature Sources
Medical
Miscellaneous

