. 2015 Feb;125(2):809-23.
doi: 10.1172/JCI77186. Epub 2015 Jan 9.

Retinoid X receptors orchestrate osteoclast differentiation and postnatal bone remodeling

Retinoid X receptors orchestrate osteoclast differentiation and postnatal bone remodeling

María P Menéndez-Gutiérrez et al. J Clin Invest. 2015 Feb.

Abstract

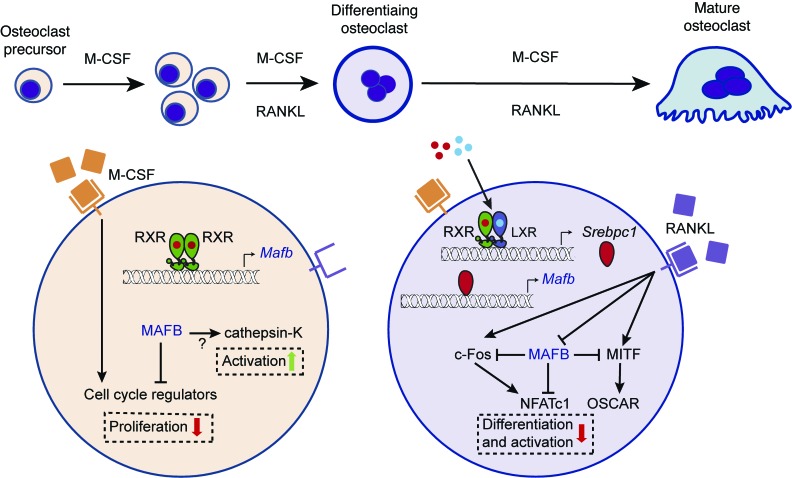
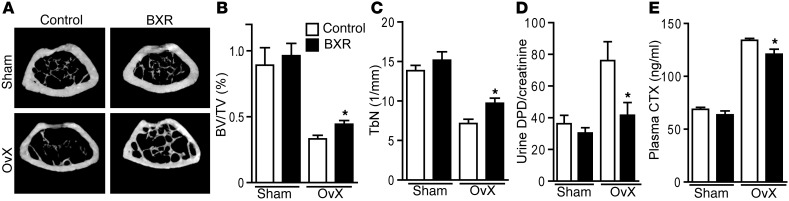
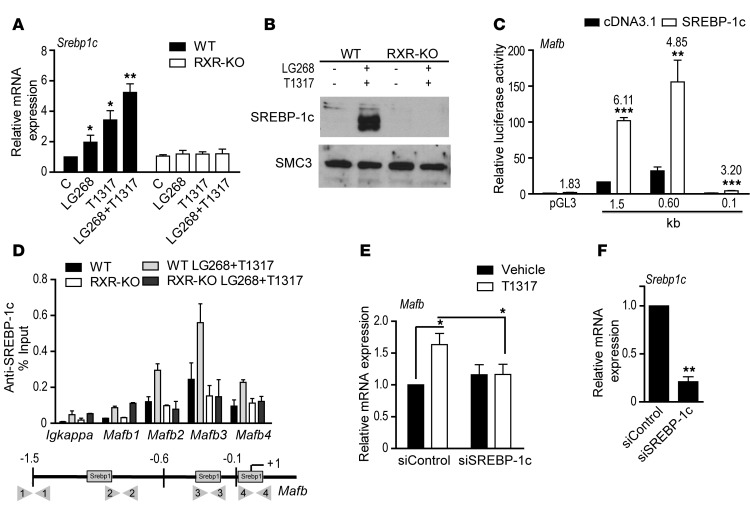
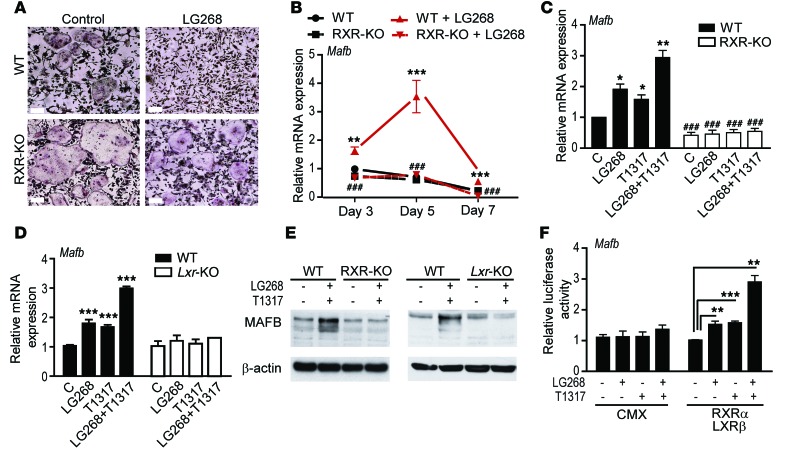
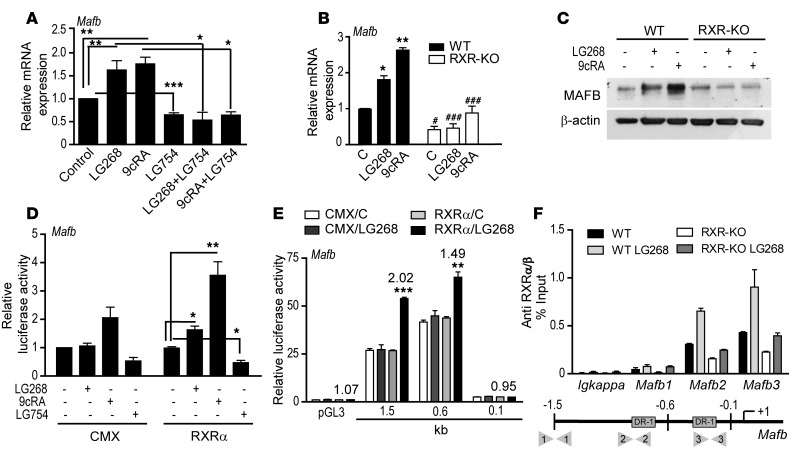
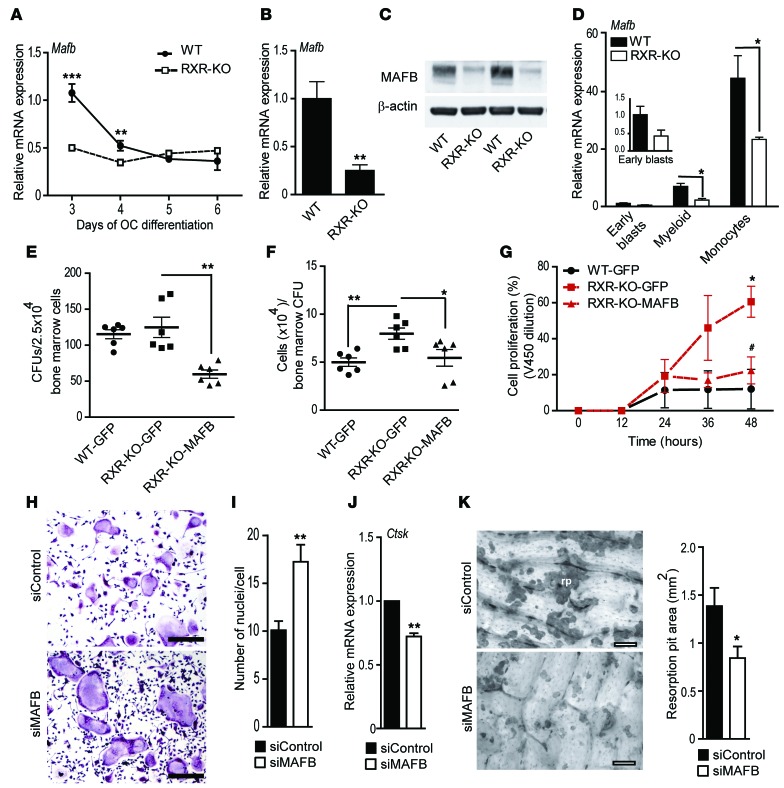
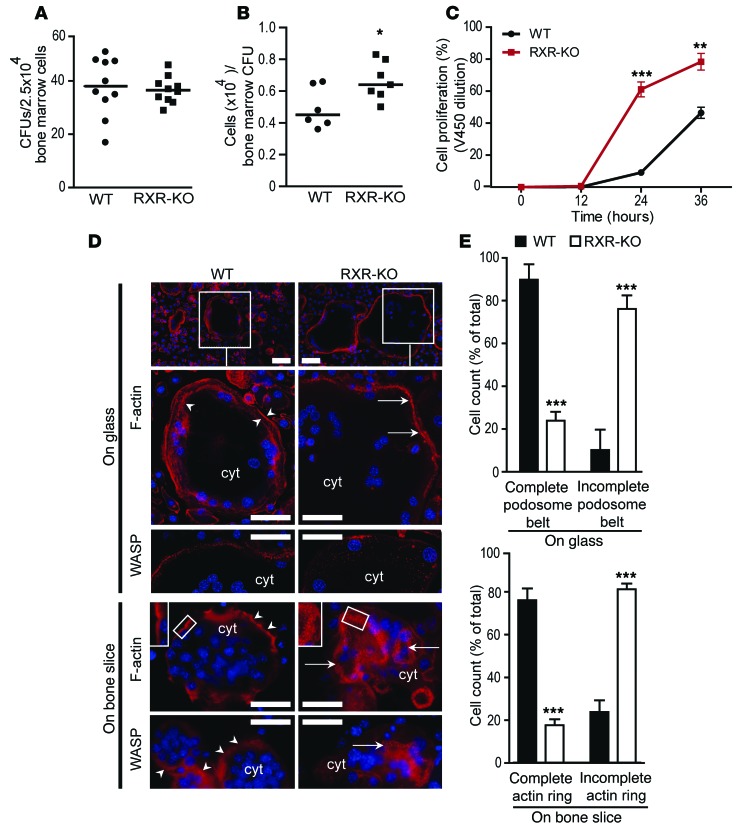
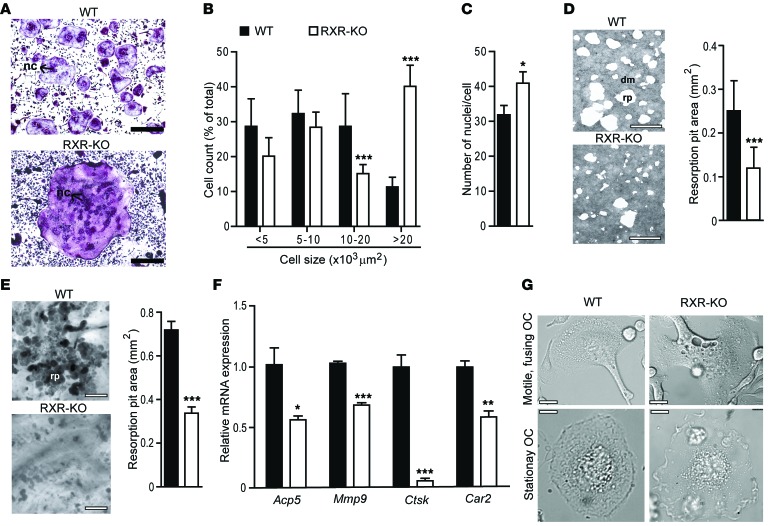
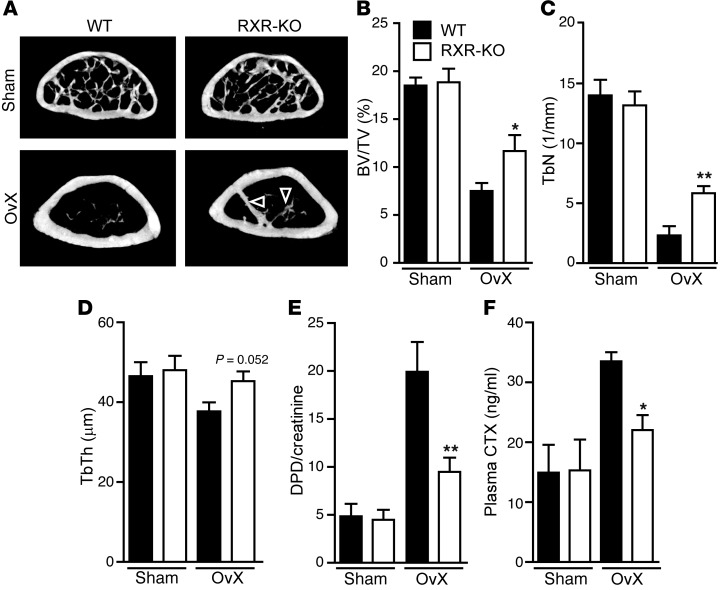
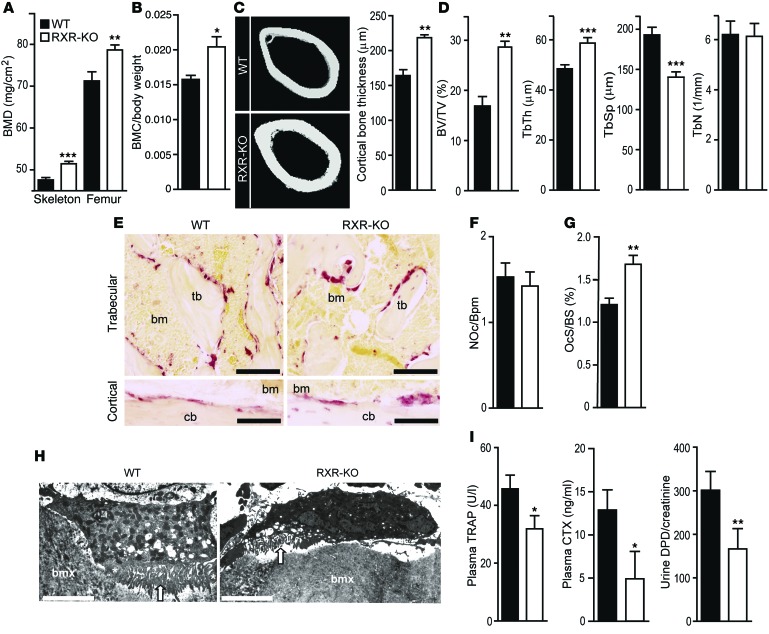
Osteoclasts are bone-resorbing cells that are important for maintenance of bone remodeling and mineral homeostasis. Regulation of osteoclast differentiation and activity is important for the pathogenesis and treatment of diseases associated with bone loss. Here, we demonstrate that retinoid X receptors (RXRs) are key elements of the transcriptional program of differentiating osteoclasts. Loss of RXR function in hematopoietic cells resulted in formation of giant, nonresorbing osteoclasts and increased bone mass in male mice and protected female mice from bone loss following ovariectomy, which induces osteoporosis in WT females. The increase in bone mass associated with RXR deficiency was due to lack of expression of the RXR-dependent transcription factor v-maf musculoaponeurotic fibrosarcoma oncogene family, protein B (MAFB) in osteoclast progenitors. Evaluation of osteoclast progenitor cells revealed that RXR homodimers directly target and bind to the Mafb promoter, and this interaction is required for proper osteoclast proliferation, differentiation, and activity. Pharmacological activation of RXRs inhibited osteoclast differentiation due to the formation of RXR/liver X receptor (LXR) heterodimers, which induced expression of sterol regulatory element binding protein-1c (SREBP-1c), resulting in indirect MAFB upregulation. Our study reveals that RXR signaling mediates bone homeostasis and suggests that RXRs have potential as targets for the treatment of bone pathologies such as osteoporosis.


Figures

Figure 10
Figure 10. Schematic of RXR/MAFB signaling in osteoclastogenesis.
RXR homodimers sustain Mafb transcription in osteoclast precursors, allowing a proper proliferative response to M-CSF and expression of cathepsin-K during osteoclast differentiation. In differentiating osteoclasts, ligand activation of RXR/LXR heterodimers induces the expression of Mafb through SREBP-1c. As a result, MAFB counteracts RANKL signaling and inhibits osteoclast differentiation and activation.
Figure 9
Figure 9. Protective effect of pharmacological RXR activation on bone loss.
(A) Representative μCT images of 3 mice per genotype, showing the femur of control and bexarotene-treated female mice that underwent sham surgery or OvX. BXR, bexarotene. (B and C) Histomorophometric analysis of the tibial end of the femur. n = 8 per group. (D and E) Levels of plasma and urine osteoclast activity markers. n = 5 in sham-treated and n = 6 in OvX per group. 20-week-old female mice were used for these experiments; data are presented as mean ± SEM. *P < 0.05, compared with vehicle-treated ovariectomized mice (unpaired 2-tailed Student’s t test).
Figure 8
Figure 8. RXR/LXR induces Mafb transcription though SREBP-1c.
(A) Srebp1c mRNA expression in WT and RXR-KO osteoclast progenitors treated with vehicle (C) or ligands for RXR (LG268) and LXR (T1317). *P < 0.01; **P < 0.001, compared with WT vehicle-treated cells (C). (B) SREBP-1c protein expression in nuclear extracts from osteoclast progenitors treated with vehicle or ligands for RXR (LG268) and LXR (T1317); SMC3 was used as loading control. (C) Luciferase reporter assay in RAW264.7 cells transfected with SREBP-1c or empty cDNA3.1 vector together with the indicated Mafb promoter or pGL3 control reporters; data are presented relative to values obtained with the vehicle-treated pGL3 reporter in the absence of SREBP-1c (cDNA3.1). Indicated fold inductions represent (SREBP-1c)/(cDNA3.1). **P < 0.01; ***P < 0.001, compared with reporter activity in the absence of SREBP-1c. (D) ChIP analysis of SREBP-1c binding to –1.5 kb (Mafb1), –1.0 kb (Mafb2), –0.4 kb (Mafb3), and transcription starting (Mafb4) regions of the Mafb promoter or to a negative control (Igkappa) in osteoclast progenitors. Lower panel, localization of SREBP-1c–binding sites in the Mafb promoter. Arrows indicate the position of primers used for ChIP; the experiment shown is representative of 3 done in triplicate. mRNA expression of Mafb (E) and Srebp1c (F) in osteoclast progenitors transfected with control siRNA (siControl) or Srebp1c siRNA (siSREBP-1c). Data are presented as mean ± SEM (n = 3 per group). *P < 0.01; **P < 0.001, by paired (A) or unpaired (C, E, and F) 2-tailed Student’s t tests.
Figure 7
Figure 7. Pharmacological activation of RXR/LXR heterodimers blocks osteoclast differentiation through upregulation of MAFB.
(A and B) In vitro osteoclast differentiation from WT and RXR-KO bone marrow cells, treated with vehicle (control) or LG268. (A) Representative mature osteoclasts identified as multinucleated TRAP+ cells. Scale bars: 100 μm. (B) Mafb mRNA expression over a time course of osteoclast differentiation. **P < 0.01; ***P < 0.001, compared with WT. ###P < 0.001 for RXR-KO + LG268 compared with WT + LG268. (C and D) Mafb mRNA expression in WT and RXR-KO or Lxr-KO osteoclast progenitors treated with vehicle (C) or ligands for RXR (LG268) and LXR (T1317). *P < 0.05; **P < 0.01; ***P < 0.001, compared with WT vehicle-treated cells (C) (paired 2-tailed Student’s t test), ###P < 0.001 versus the equivalent treatment in WT cells (unpaired 2-tailed Student’s t test). (E) MAFB protein in WT and RXR-KO or Lxr-KO osteoclast progenitors treated with vehicle or ligands for RXR (LG268) and LXR (T1317); representative of 3 independent experiments. (F) Luciferase reporter assay in RAW264.7 cells transfected with RXRα and LXRβ or CMX empty vector together with a reporter vector containing 1.5 kb of the Mafb promoter. Data are presented relative to values obtained with the vehicle-treated Mafb reporter in the absence of RXRα and LXRβ. **P < 0.01; ***P < 0.001. Data are presented as mean ± SEM (n = 3 per group); statistical comparisons were made by paired (D and F) or unpaired (B) 2-tailed Student’s t test.
Figure 6
Figure 6. RXR homodimers regulate Mafb expression in osteoclast progenitors.
(A) Mafb mRNA expression in WT osteoclast progenitors treated with the RXR agonists LG268 and 9cRA and with the antagonist of RXR homodimers LG754. Mafb mRNA (B) and protein (C) expression in WT and RXR-KO osteoclast progenitors treated with LG268 or 9cRA. *P < 0.05; **P < 0.01, compared with WT vehicle-treated cells (C) (paired 2-tailed Student’s t test). #P < 0.05; ##P < 0.01, versus the equivalent treatment in WT cells (unpaired 2-tailed Student’s t test). (D and E) Luciferase reporter assays in RAW264.7 cells transfected with (D) RXRα or CMX empty vector together with a reporter vector containing 1.5 kb of the Mafb promoter or (E) the indicated Mafb promoter and pGL3 control reporters. Data are relative values compared with the vehicle-treated Mafb reporter (D) or the vehicle-treated pGL3 reporter (E) in the absence of RXRα; in E, the indicated fold inductions represent (RXRα/LG268)/(RXRα/C). **P < 0.01; ***P < 0.001, compared with vehicle-treated reporter in the presence of RXRα. (F) ChIP analysis of RXRα/β binding to –1.5 kb (Mafb1), –1.0 kb (Mafb2), and –0.4 kb (Mafb3) regions of the Mafb promoter or to a negative control (Igkappa) in osteoclast progenitors. Lower panel, localization of RXR-binding sites in the Mafb promoter. Arrows indicate the position of primers used for qPCR. Experiment shown is representative of 3 done in triplicate. Data are presented as mean ± SEM (n = 3 per group). *P < 0.05; **P < 0.01; ***P < 0.001, by paired 2-tailed Student’s t test (A, D, and E). C is representative of 3 independent experiments.
Figure 5
Figure 5. Low MAFB expression in osteoclast progenitors underlies the abnormal RXR-KO osteoclast phenotype.
(A and B) Relative mRNA expression of Mafb in the course of osteoclast differentiation in vitro (A) and in osteoclast progenitors (B). **P < 0.01; ***P < 0.001, compared with RXR-KO cells on the same day of differentiation. (C) MAFB protein expression in osteoclast progenitors (representative of 3 mice per genotype). (D) Mafb mRNA expression in bone marrow myeloid populations; cells were isolated as shown in Supplemental Figure 1D. (EG) Proliferation assays in lentiviral-mediated MAFB-overexpressing RXR-KO osteoclast progenitors: number of CFUs (E) and number of cells per CFU (F) in bone marrow cell cultures infected with control lentivirus (WT-GFP and RXR-KO-GFP) and with MAFB lentivirus (RXR-KO-MAFB). n = 6 per group. (G) Flow cytometry analysis of the proliferative responses of osteoclast progenitors infected with control lentivirus (WT-GFP and RXR-KO-GFP) and with MAFB lentivirus (RXR-KO-MAFB). n = 3 per group. *P < 0.05, compared with WT-GFP; #P < 0.01, compared with RXR-KO-GFP. (HK) siRNA assay: representative TRAP-positive cells (H), number of nuclei (I), Ctsk expression (J), and resorption pit area (K) in osteoclast cultures after 5 days of differentiation from bone marrow cells transfected with control or Mafb siRNAs. *P < 0.05; **P < 0.01, compared with siControl. Resorption activity was measured after culturing day-5 osteoclasts on bone bovine cortical bone slices for 2 additional days; the experiment shown is representative of 3 independent experiments done in triplicate. Scale bars: 100 μm. Data are presented as mean ± SEM. Statistical comparisons were made by unpaired 2-tailed Student’s t test.
Figure 4
Figure 4. Altered RXR-KO osteoclast progenitor proliferation and cytoskeletal organization in response to M-CSF.
(A and B) CFU assay in bone marrow: CFU number (A) and number of cells per CFU (B) in WT and RXR-KO osteoclast progenitor cultures. n = 6–10 per genotype. (C) Flow cytometry analysis of the proliferative responses of WT and RXR-KO bone marrow osteoclast progenitors (representative of 3 independent experiments done in triplicate). (D) Phalloidin labeling of F-actin and WASP staining of osteoclasts cultured on glass coverslips or bovine cortical bone slices. cyt, cytoplasm. Arrows show podosomes; arrowheads indicate podosome belts (on glass) and actin rings (on bone). Scale bars: 25 μm. (E) Percentage of cultured osteoclasts with a complete podosome belt or actin ring or with incomplete actin ring and scattered podosomes (representative experiment [n = 3–7 replicates] of 2–3 performed). C and E are presented as mean ± SEM. *P < 0.05; **P < 0.01; ***P < 0.001, compared with WT, using unpaired 2-tailed Student’s t test (C) or 2-tailed Mann-Whitney U test (E).
Figure 3
Figure 3. Giant and nonresorbing osteoclasts develop in the absence of RXRs.
(A) TRAP-positive osteoclasts differentiated from bone marrow of WT and RXR-KO mice. nc, nuclei. Scale bars: 100 μM. (B and C) Cell size and number of nuclei in the cultured TRAP-positive osteoclasts. (D) Resorption activity of osteoclasts was measured by plating them on calcium-phosphate–coated plates; the remaining matrix (dm) is stained with Toluidine Blue; area of resorption pits (rp) was quantified. Scale bars: 100 μm. n = 6 per genotype. (E) Resorption activity of osteoclasts on bovine cortical bone slices; the resorption pits were stained with Toluidine Blue, and the resorption pit area was quantified. Scale bars: 100 μm. n = 6 per genotype. (F) Relative mRNA expression of osteoclast activity genes in in vitro–differentiated osteoclasts. n = 3 per genotype. (G) DIC images showing motile and stationary osteoclasts (OC) in vitro (see Supplemental Video 1). Data are presented as mean ± SEM. *P < 0.05; **P < 0.01; ***P < 0.001, compared with WT (unpaired 2-tailed Student’s t test). AC and F show representative experiments of 3 done in triplicate.
Figure 2
Figure 2. Therapeutic potential of RXR deletion in a model of postmenopausal osteoporosis.
(A) Representative μCT images of 3 mice per genotype, showing the femur 1 mm below the distal epiphysis; arrowheads point to bone trabecules. (BD) Bone histomorphometry of the femur. n = 6 per genotype. (E and F) Levels of plasma and urine osteoclast activity markers. n = 6 per genotype. 20-week-old female mice were used in the experiments; data are presented as mean ± SEM. *P < 0.05; **P < 0.01, compared with ovariectomized WT mice (unpaired 2-tailed Student’s t test).
Figure 1
Figure 1. Increased bone mass and reduced osteoclast activity in 20-week-old RXR-KO male mice.
(A and B) BMD and BMC measured by DEXA; BMC values are normalized to body weight (g/g). n = 8 mice per genotype. (C) Representative μCT images showing cortical bone of the femoral shaft and cortical bone thickness measured on μCT scans. n = 5 mice per genotype. (D) Histomorphometric analysis of the tibial end of the femur. BV/TV (%), relative trabecular bone volume; TbTh, trabecule thickness; TbSp, trabecule separation; TbN, trabecule number. n = 8 per genotype. (E) TRAP staining of the tibial end of the femur. bm, bone marrow; tb, trabecule; cb, cortical bone. Scale bars: 85 μm. (F and G) Osteoclast number (NOc/Bpm) (mm-1) and surface (OcS/Bs) (%) in femur sections, normalized to bone perimeter (Bpm) and bone surface (BS). n = 6 per genotype. (H) Representative TEM images of osteoclasts in the femur from 2 independent studies using 3 mice per genotype. bmx, bone matrix. Arrows show ruffled border; asterisks indicate the attachment zone. Scale bars: 5 μm. (I) Clinical chemistry of osteoclast activity. n = 9 (TRAP, DPD) and 6 (CTX) per genotype. Data are presented as mean ± SEM. *P < 0.05; **P < 0.01; ***P < 0.001, compared with WT (unpaired 2-tailed Student’s t test).

Similar articles

Cited by

References

    1. Kanis JA, McCloskey EV, Johansson H, Oden A. Approaches to the targeting of treatment for osteoporosis. Nat Rev Rheumatol. 2009;5(8):425–431. doi: 10.1038/nrrheum.2009.139. - DOI - PubMed
    1. DiGirolamo DJ, Clemens TL, Kousteni S. The skeleton as an endocrine organ. Nat Rev Rheumatol. 2012;8(11):674–683. doi: 10.1038/nrrheum.2012.157. - DOI - PubMed
    1. O’Brien CA, Nakashima T, Takayanagi H. Osteocyte control of osteoclastogenesis. Bone. 2013;54(2):258–263. doi: 10.1016/j.bone.2012.08.121. - DOI - PMC - PubMed
    1. Harvey N, Dennison E, Cooper C. Osteoporosis: impact on health and economics. Nat Rev Rheumatol. 2010;6(2):99–105. doi: 10.1038/nrrheum.2009.260. - DOI - PubMed
    1. Vanderschueren D, Boonen S, Bouillon R. Physiology of calcium homeostasis and bone remodeling. In: Geusens P, Sambrook P, Lindsay R, eds. Osteoporosis in Clinical Practice: A Practical Guide for Diagnosis and Treatment. 2nd ed. London, United Kingdom: Springer London; 2004:9–14.

Publication types

MeSH terms