. 2015 Jan 7:6:5717.
doi: 10.1038/ncomms6717.

A lysine-rich motif in the phosphatidylserine receptor PSR-1 mediates recognition and removal of apoptotic cells

Affiliations

A lysine-rich motif in the phosphatidylserine receptor PSR-1 mediates recognition and removal of apoptotic cells

Hengwen Yang et al. Nat Commun. .

Abstract

The conserved phosphatidylserine receptor (PSR) was first identified as a receptor for phosphatidylserine, an 'eat-me' signal exposed by apoptotic cells. However, several studies suggest that PSR may also act as an arginine demethylase, a lysyl hydroxylase, or an RNA-binding protein through its N-terminal JmjC domain. How PSR might execute drastically different biochemical activities, and whether they are physiologically significant, remain unclear. Here we report that a lysine-rich motif in the extracellular domain of PSR-1, the Caenorhabditis elegans PSR, mediates specific phosphatidylserine binding in vitro and clearance of apoptotic cells in vivo. This motif also mediates phosphatidylserine-induced oligomerization of PSR-1, suggesting a mechanism by which PSR-1 activates phagocytosis. Mutations in the phosphatidylserine-binding motif, but not in its Fe(II) binding site critical for the JmjC activity, abolish PSR-1 phagocytic function. Moreover, PSR-1 enriches and clusters around apoptotic cells during apoptosis. These results establish that PSR-1 is a conserved, phosphatidylserine-recognizing phagocyte receptor.


Figures
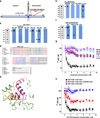
Figure 1
Figure 1. Identification of a lysine-rich PS-binding motif in PSR-1
(a) A schematic cartoon of PSR-1 with its extra- and intra-cellular domains. The conserved Fe(II)-binding site (H192/D194) and the PS-binding motif (PSB) are shown. (b, c, f) In vitro lipid binding assays. Membrane strips containing equal amounts (500 pmol) of the indicated phospholipids were incubated with 5 µg/ml of purified proteins as indicated (see Methods). The lactadherin C2 domain (Lact-C2), known to bind PS, is used as a positive control. After washed three times with washing buffer, the membrane strips were probed with anti-His6 (b) or anti-GST (c, f) antibodies. PSR-1 domains and mutations included are as indicated. The strip template on the left depicts phospholipids loaded on the membrane. PS, phosphatidylserine; PC, phosphatidylcholine; PE, phosphatidylethanolamine; PG, phosphatidylglycerol; PA, phosphatidic acid; PI, phosphatidylinositol. (d) Sequence alignment of the extracellular domains of PSR proteins from different species. Residues that are identical are indicated in red, residues highly conserved in green, and residues similar in blue. Asterisks indicate seven lysine and arginine residues in PSR-1 PSB. Arrowheads depict three key lysine residues that form a PS-binding interface. (e) Ribbon representation of a modeled PSR-1 structure showing mostly its extracellular domain, in which residues 293–349 are colored in hot pink. The conserved lysine and arginine residues within PSB are shown as sticks. (g, h) Tryptophan fluorescence quenching assays. The fluorescence quenching titration curves of GST-PSR-1(293–400) with different liposomes containing 10% of the indicated phospholipids (except PC) were determined as described in Methods (g). Briefly, 0.2 µM PSR-1 proteins were titrated with different concentrations of liposomes (y axis) and the fluorescence intensity at 340 nm was plotted against liposomes concentration (see Methods). Liposome models tested were: PC liposomes (67.5% PC, 16% Cholesterol, 16.5% Sphingomyelin) and PS, PA, PE, or PI liposomes (57.5% PC, 16% Cholesterol, 16.5% Sphingomyelin), in which 10% of the specific phospholipid was included in the liposomes. The fluorescence quenching titration curves of three different PSR-1 proteins with 10% PS liposomes were determined similarly (h). Error bars indicate s.d. (n=3).
Figure 2
Figure 2. PS induces oligomerization of PSR-1
(a–e) PS-induced oligomerization of PSR-1 was analyzed by size-exclusion chromatography. Upper panels show the chromatograms of gel filtration. The protein sample (1 mg/ml) was applied to the Superdex-200 column in a total volume of 1 ml after being incubated with 400 µg/ml of the indicated phospholipid (dissolved in 0.08% DM) or 0.08% DM alone at 4°C for 1 hour (See Methods). The molecular weight standards indicate the approximate sizes of the proteins in various fractions collected. Three representative fractions were analyzed by 15% SDS–PAGE (bottom panels). (f) Crosslinking assays. Chemical crosslinking of the indicated fractions from the size-exclusion chromatography of the indicated GST-PSR-1 proteins incubated with PS was performed as described in Methods. Briefly, protein samples were incubated with or without 25 µM BS3 crosslinker on ice for 60 minutes and the reactions were terminated and resolved on 8% SDS PAGE. The arrow indicates the GST-PSR-1(293–400) oligomers. Asterisks indicate potential cross-linked GST-PSR-1 dimers, as GST fusion proteins are known to form homodimers in solution.
Figure 3
Figure 3. psr-1 promotes clearance of necrotic and apoptotic germ cells through the CED-2 pathway
(a–f, h) Time-course analysis of germ cell corpses during C. elegans germline development. Germ cell corpses from the indicated strains were scored at 24 hours, 36 hours, and 48 hours post L4 to the adult molt from one gonad arm of the animals. The y axis represents the mean number of cell corpses scored at the time point indicated on the x axis. Error bars indicate s.e.m (n=15 at each time point). (g) Time-lapse microscopy analysis of durations of persistent germ cell corpses. The persistence of germ cell corpses from wild-type N2 animals (20 corpses) and psr-1(tm469) animals (21 corpses) was monitored. The y axis indicates the persistence time for each germ cell corpse. The mean persistence time of germ cell corpses for each genotype was also shown. Error bars indicate s.e.m. The numbers of eggs laid by N2 and psr-1(tm469) animals at 24 hours, 36 hours, and 48 hours post L4 to the adult molt were counted to ensure that the germlines of the two strains had similar rates of development (Supplementary Fig. 2). (i) psr-1 acts in the ced-2 pathway to promote clearance of necrotic cell corpses. The numbers of GFP-positive, unengulfed necrotic cell corpses with vacuolar morphology in the indicated strains were scored in L4 larvae. All strains contain mec-4(u231) bzIs8. The y axis represents the mean number from three independent experiments for each genotype. Error bars indicate s.e.m (n=100 each strain). In all panels, the significance of differences between results was determined by Student’s t-tests, *P < 0.01; ** P < 0.001; ***P < 0.0001.
Figure 4
Figure 4. The PS-binding motif of PSR-1 is required for clearance of apoptotic cells
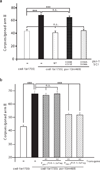
(a, b) The number of germ cell corpses per gonad arm was scored in the indicated strains at 48 hours post L4 to the adult molt as described in Fig. 3. SCI indicates single copy insertion of the psr-1 transgene (a). Complex transgenic arrays containing Ppie-1PSR-1∷3xFlag, which directs PSR-1∷3xFlag expression in germ cells under the control of the germline-specific pie-1 promoter, and transgenic arrays harboring Plim-7PSR-1∷3xFlag, which directs PSR-1∷3xFlag expression in gonadal sheath cells under the control of the lim-7 promoter, were used to assist determination of the PSR-1 acting site (b). The y-axis represents the average number of germ cell corpses. Error bars are s.e.m (n=15 each strain). Two independent transgenic lines were analyzed (b). The significance of differences between results was determined by Student’s t-tests, ***P < 0.0001. n.s. indicates no significant difference.
Figure 5
Figure 5. PSR-1 enriches and clusters on the surface of apoptotic germ cells
(a–c) Adult hermaphrodites of the indicated genotypes (24 hours post L4 to the adult molt) were dissected to expose their gonads, which were then stained with Hoechst 33342 and an anti-Flag M2 antibody using non-permeabilized conditions (see Methods). Images of Hoechst 33342, anti-Flag (Rhodamine), DIC, and the merged image of Rhodamine/Hoechst are shown. Arrowheads indicate apoptotic germ cells with characteristic condensed Hoechst staining and distinct corpse morphology under DIC. Scale bars represent 10 µm.
Figure 6
Figure 6. Model of PSR-1-mediated clearance of apoptotic cells
PS exposed on the surface of the apoptotic cell interacts with and induces oligomerization of PSR-1, which then transduces the “eat-me” signal through interacting with CED-5 and CED-12, leading to the activation of the CED-10 GTPase and membrane extension of the phagocyte to enclose and internalize the apoptotic cell. At least one unknown phagocyte receptor (?) acts in parallel to PSR-1 in this signaling pathway.

Similar articles

Cited by

References

    1. Savill J, Fadok V. Corpse clearance defines the meaning of cell death. Nature. 2000;407:784–788. - PubMed
    1. Fadeel B. Programmed cell clearance. Cellular and molecular life sciences : CMLS. 2003;60:2575–2585. - PMC - PubMed
    1. Fadok VA, et al. Exposure of phosphatidylserine on the surface of apoptotic lymphocytes triggers specific recognition and removal by macrophages. J Immunol. 1992;148:2207–2216. - PubMed
    1. Ashman RF, Peckham D, Alhasan S, Stunz LL. Membrane unpacking and the rapid disposal of apoptotic cells. Immunol Lett. 1995;48:159–166. - PubMed
    1. Fadok VA, Bratton DL, Frasch SC, Warner ML, Henson PM. The role of phosphatidylserine in recognition of apoptotic cells by phagocytes. Cell Death Differ. 1998;5:551–562. - PubMed

Publication types

MeSH terms