

Peripheral insulin resistance and impaired insulin signaling contribute to abnormal glucose metabolism in preterm baboons
- PMID: 25560831
- PMCID: PMC4330304
- DOI: 10.1210/en.2014-1757
Peripheral insulin resistance and impaired insulin signaling contribute to abnormal glucose metabolism in preterm baboons
Abstract
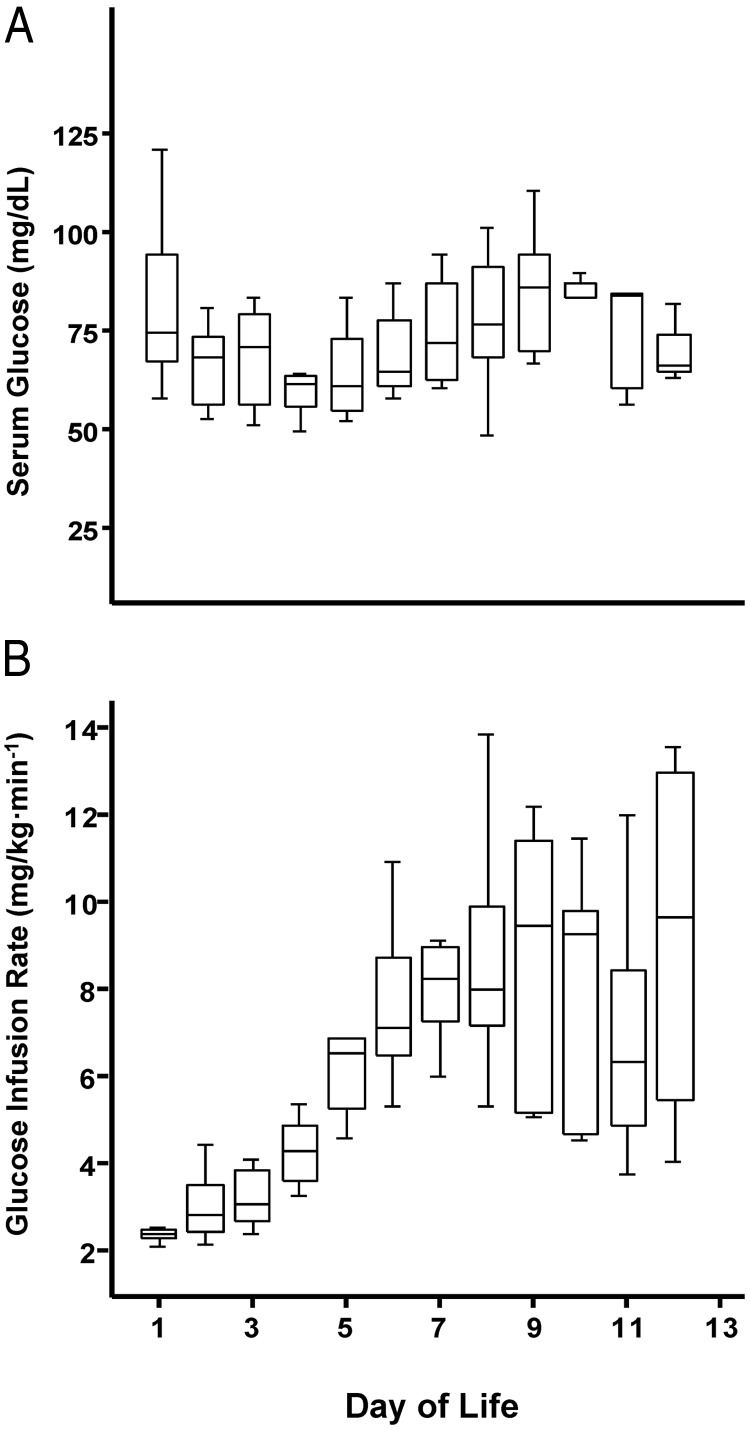
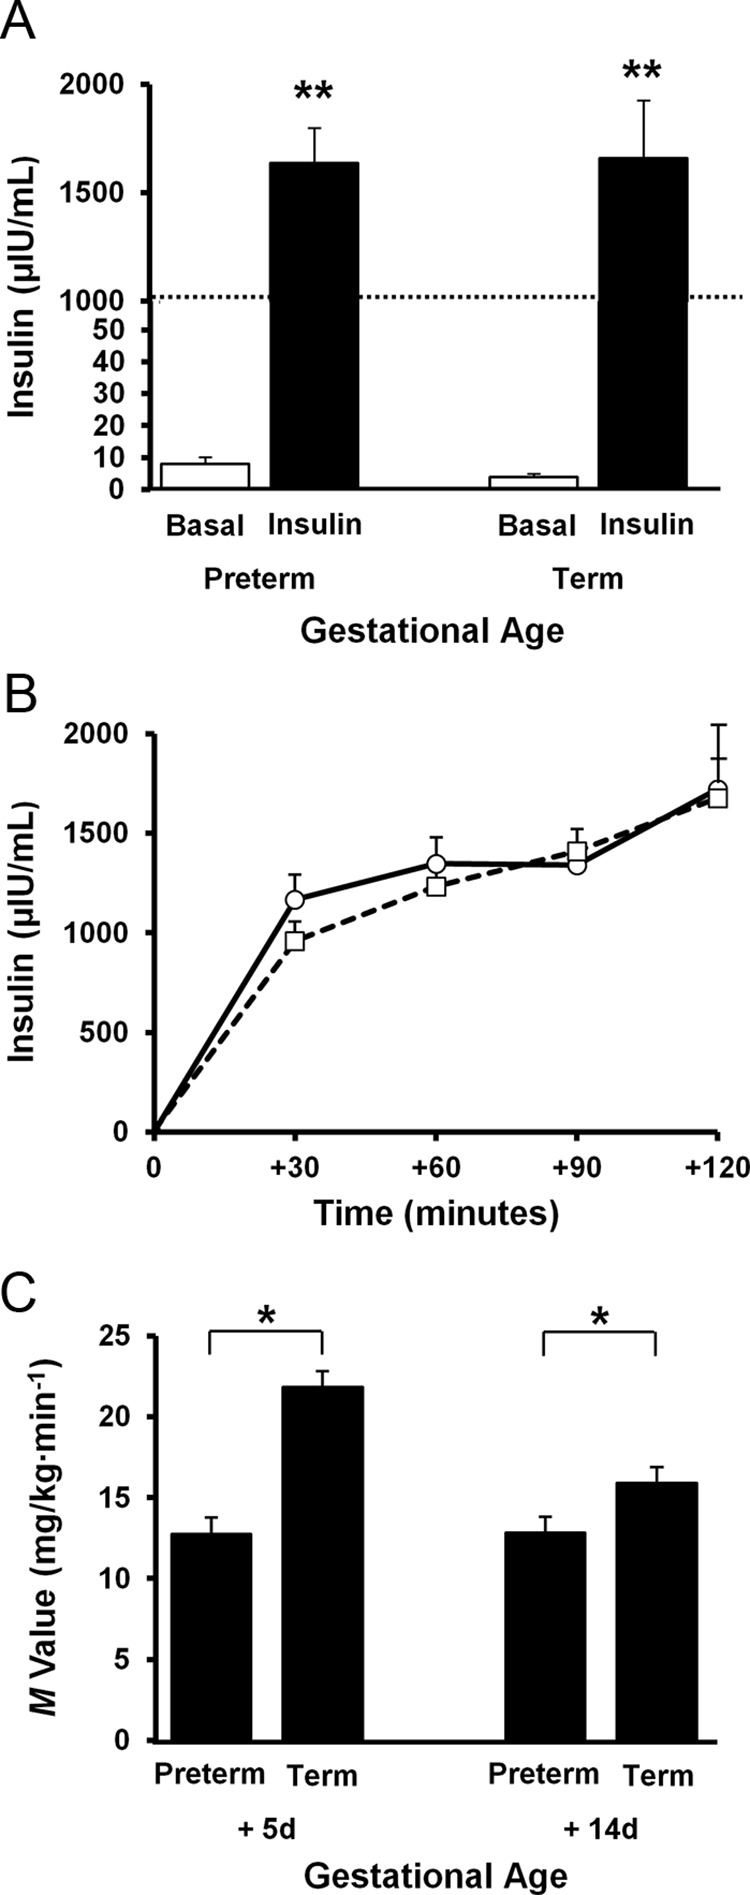
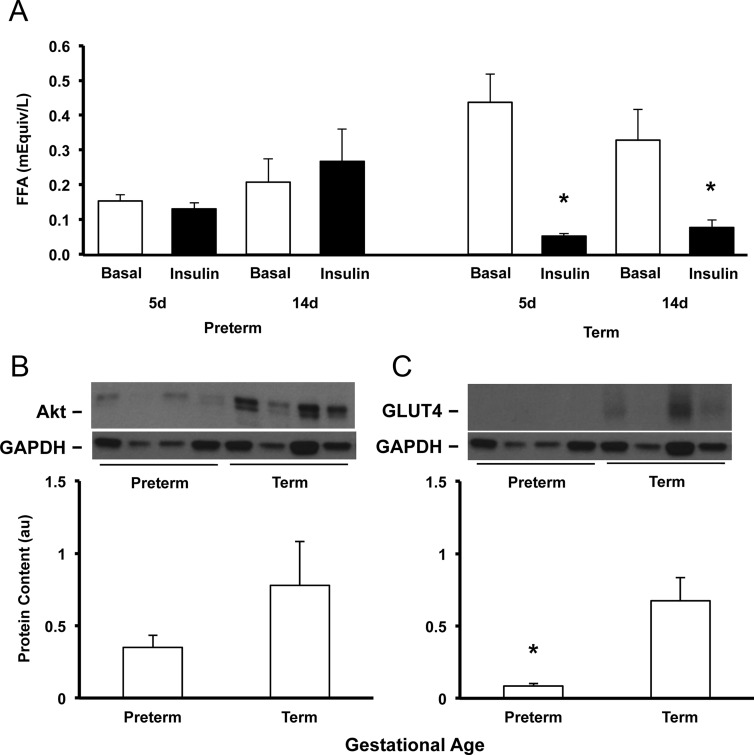
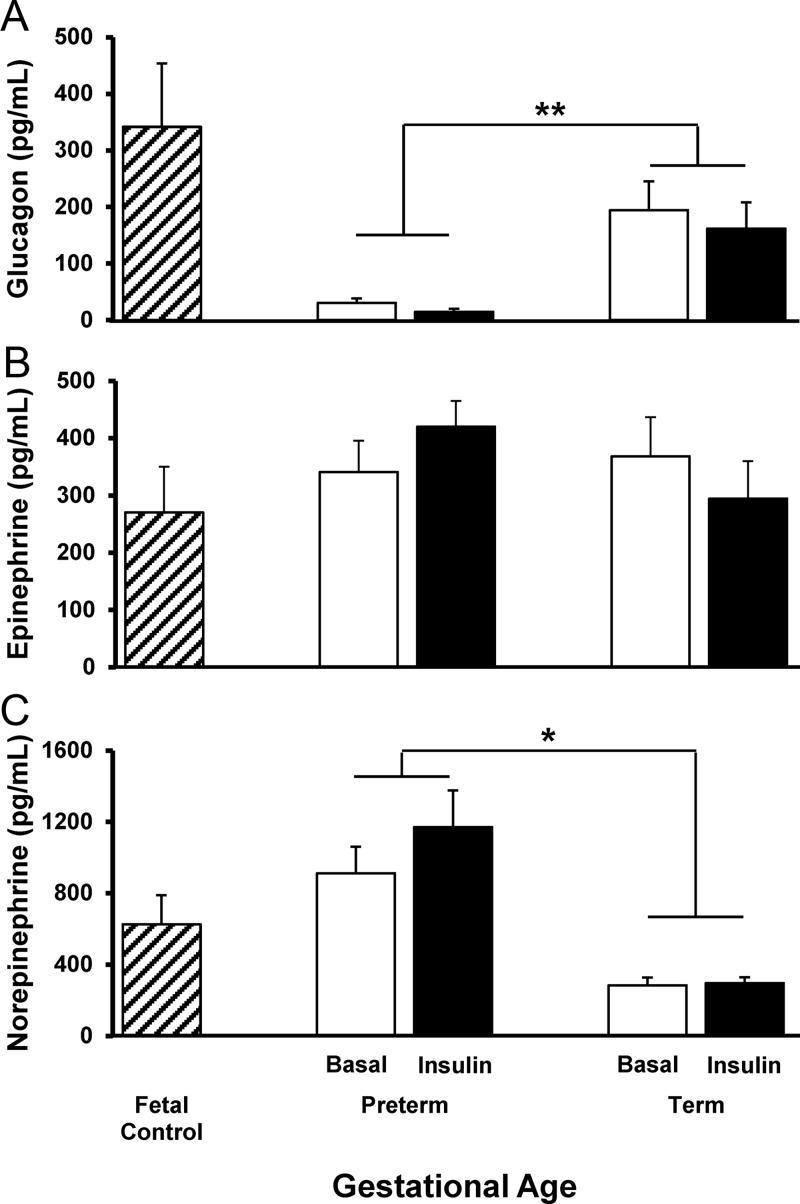
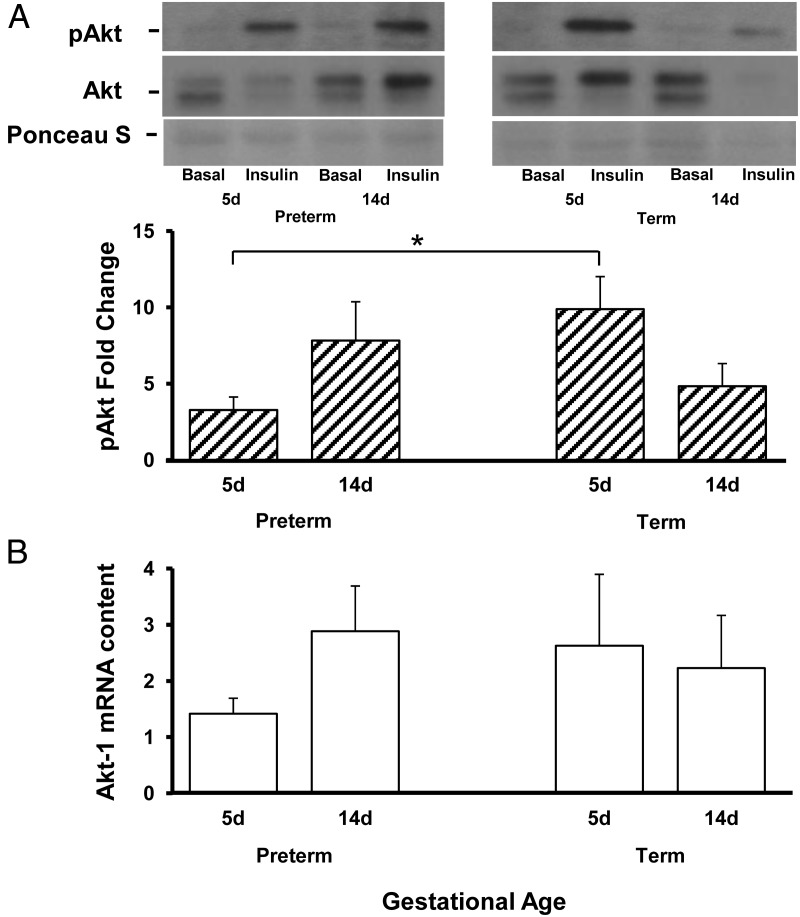
Premature infants develop hyperglycemia shortly after birth, increasing their morbidity and death. Surviving infants have increased incidence of diabetes as young adults. Our understanding of the biological basis for the insulin resistance of prematurity and developmental regulation of glucose production remains fragmentary. The objective of this study was to examine maturational differences in insulin sensitivity and the insulin-signaling pathway in skeletal muscle and adipose tissue of 30 neonatal baboons using the euglycemic hyperinsulinemic clamp. Preterm baboons (67% gestation) had reduced peripheral insulin sensitivity shortly after birth (M value 12.5 ± 1.5 vs 21.8 ± 4.4 mg/kg · min in term baboons) and at 2 weeks of age (M value 12.8 ± 2.6 vs 16.3 ± 4.2, respectively). Insulin increased Akt phosphorylation, but these responses were significantly lower in preterm baboons during the first week of life (3.2-fold vs 9.8-fold). Preterm baboons had lower glucose transporter-1 protein content throughout the first 2 weeks of life (8%-12% of term). In preterm baboons, serum free fatty acids (FFAs) did not decrease in response to insulin, whereas FFAs decreased by greater than 80% in term baboons; the impaired suppression of FFAs in the preterm animals was paired with a decreased glucose transporter-4 protein content in adipose tissue. In conclusion, peripheral insulin resistance and impaired non-insulin-dependent glucose uptake play an important role in hyperglycemia of prematurity. Impaired insulin signaling (reduced Akt) contributes to the defect in insulin-stimulated glucose disposal. Counterregulatory hormones are not major contributors.
Figures

Similar articles
-
Hepatic Insulin Resistance and Altered Gluconeogenic Pathway in Premature Baboons.Endocrinology. 2017 May 1;158(5):1140-1151. doi: 10.1210/en.2016-1806. Endocrinology. 2017. PMID: 28324053 Free PMC article.
-
The ontogeny of insulin signaling in the preterm baboon model.Endocrinology. 2010 May;151(5):1990-7. doi: 10.1210/en.2009-0777. Epub 2010 Mar 16. Endocrinology. 2010. PMID: 20233798 Free PMC article.
-
Effects of intravenous AICAR (5-aminoimidazole-4-carboximide riboside) administration on insulin signaling and resistance in premature baboons, Papio sp.PLoS One. 2018 Dec 12;13(12):e0208757. doi: 10.1371/journal.pone.0208757. eCollection 2018. PLoS One. 2018. PMID: 30540820 Free PMC article.
-
Metabolism and insulin signaling in common metabolic disorders and inherited insulin resistance.Dan Med J. 2014 Jul;61(7):B4890. Dan Med J. 2014. PMID: 25123125 Review.
-
Biochemical and molecular basis of insulin resistance.Curr Protein Pept Sci. 2006 Apr;7(2):113-21. doi: 10.2174/138920306776359759. Curr Protein Pept Sci. 2006. PMID: 16611137 Review.
Cited by
-
Systematic Understanding of Pathophysiological Mechanisms of Oxidative Stress-Related Conditions-Diabetes Mellitus, Cardiovascular Diseases, and Ischemia-Reperfusion Injury.Front Cardiovasc Med. 2021 Apr 13;8:649785. doi: 10.3389/fcvm.2021.649785. eCollection 2021. Front Cardiovasc Med. 2021. PMID: 33928135 Free PMC article. Review.
-
Dilemmas in parenteral glucose delivery and approach to glucose monitoring and interpretation in the neonate.J Perinatol. 2023 Sep;43(9):1200-1205. doi: 10.1038/s41372-023-01640-5. Epub 2023 Mar 24. J Perinatol. 2023. PMID: 36964206 Review.
-
Preterm birth alters the feeding-induced activation of Akt signaling in the muscle of neonatal piglets.Pediatr Res. 2023 Jun;93(7):1891-1898. doi: 10.1038/s41390-022-02382-4. Epub 2022 Nov 19. Pediatr Res. 2023. PMID: 36402914 Free PMC article.
-
Adipose and Liver Function in Primate Offspring with Insulin Resistance Induced by Estrogen Deprivation in Utero.Endocrinol Diabetes Metab J. 2017 Aug;1(3):http://researchopenworld.com/wp-content/uploads/2017/10/EDMJ-2017-109-Gerald-J.-Pepe-USA.pdf. Epub 2017 Sep 12. Endocrinol Diabetes Metab J. 2017. PMID: 29983904 Free PMC article.
-
Prematurity disrupts glomeruli development, whereas prematurity and hyperglycemia lead to altered nephron maturation and increased oxidative stress in newborn baboons.Pediatr Res. 2018 Mar;83(3):702-711. doi: 10.1038/pr.2017.290. Epub 2018 Jan 3. Pediatr Res. 2018. PMID: 29166383 Free PMC article.
References
-
- Martin JA, Hamilton BE, Ventura SJ, Osterman MJK, Matthews TJ. Births: final data for 2011. Centers for Disease Control and Prevention, National Center for Health Statistics. Natl Vital Stat Rep. 2013;62(1):1–69, 72. - PubMed
-
- Whincup PH, Kaye SJ, Owen CG, et al. Birth weight and risk of type 2 diabetes. JAMA. 2008;300:2886–2897. - PubMed
-
- Hovi P, Andersson S, Eriksson JG, et al. Glucose regulation in young adults with very low birth weight. N Engl J Med. 2007;356:2053–2063. - PubMed
-
- Hofman PL, Regan F, Cutfield WS. Prematurity—another example of perinatal metabolic programming? Horm Res. 2006;66:33–39. - PubMed
-
- Rotteveel J, van Weissenbruch MM, Delemarre-Van de Waal HA. Decreased insulin sensitivity in small for gestational age males treated with GH and preterm untreated males: a study in young adults. Eur J Endocrinol. 2008;158:899–904. - PubMed
Publication types
MeSH terms
Substances
Grants and funding
- R01 DK024092/DK/NIDDK NIH HHS/United States
- KL2 TR000118/TR/NCATS NIH HHS/United States
- UL1 RR025767/RR/NCRR NIH HHS/United States
- K23 AG030979/AG/NIA NIH HHS/United States
- KL2 TR001118/TR/NCATS NIH HHS/United States
- AG030979/AG/NIA NIH HHS/United States
- DK24092/DK/NIDDK NIH HHS/United States
- UL1RR025767/RR/NCRR NIH HHS/United States
- R01 DK080157/DK/NIDDK NIH HHS/United States
- U01 HL052636/HL/NHLBI NIH HHS/United States
- R56 DK024092/DK/NIDDK NIH HHS/United States
- HL52636/HL/NHLBI NIH HHS/United States
- P51RR13986/RR/NCRR NIH HHS/United States
- P51 OD011133/OD/NIH HHS/United States
- UL1 TR001120/TR/NCATS NIH HHS/United States
- DK080157/DK/NIDDK NIH HHS/United States
- P51 RR013986/RR/NCRR NIH HHS/United States
LinkOut - more resources
Full Text Sources
Other Literature Sources
