

Comparison and integration of deleteriousness prediction methods for nonsynonymous SNVs in whole exome sequencing studies
- PMID: 25552646
- PMCID: PMC4375422
- DOI: 10.1093/hmg/ddu733
Comparison and integration of deleteriousness prediction methods for nonsynonymous SNVs in whole exome sequencing studies
Abstract
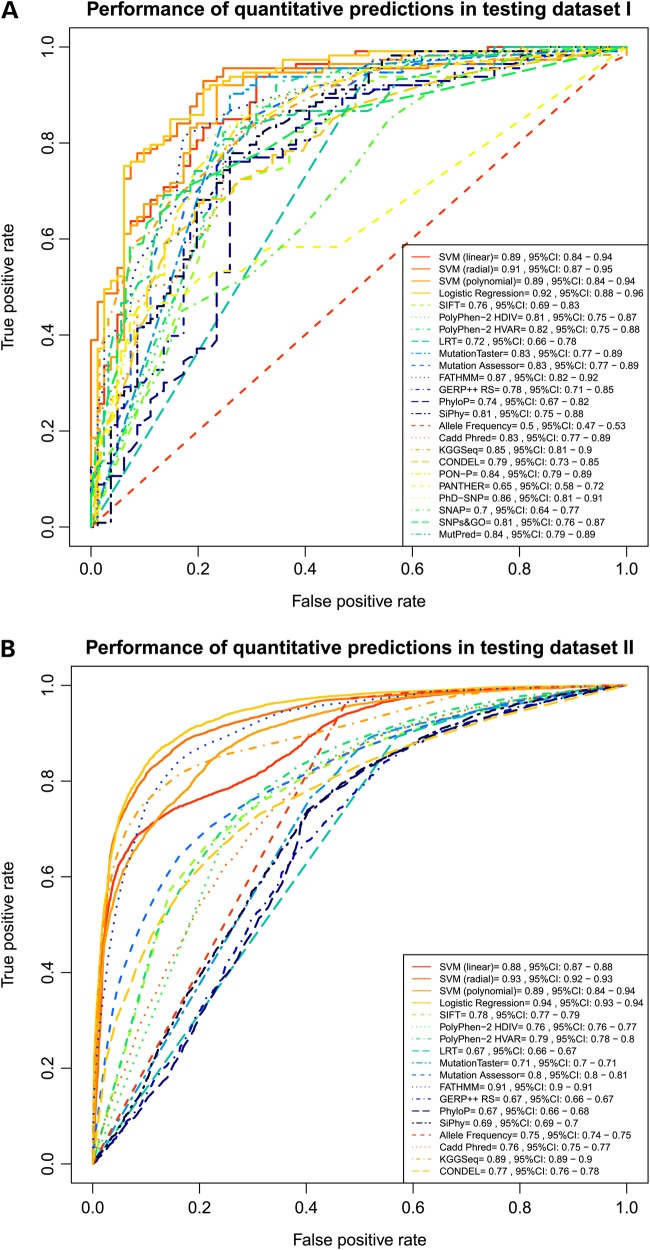
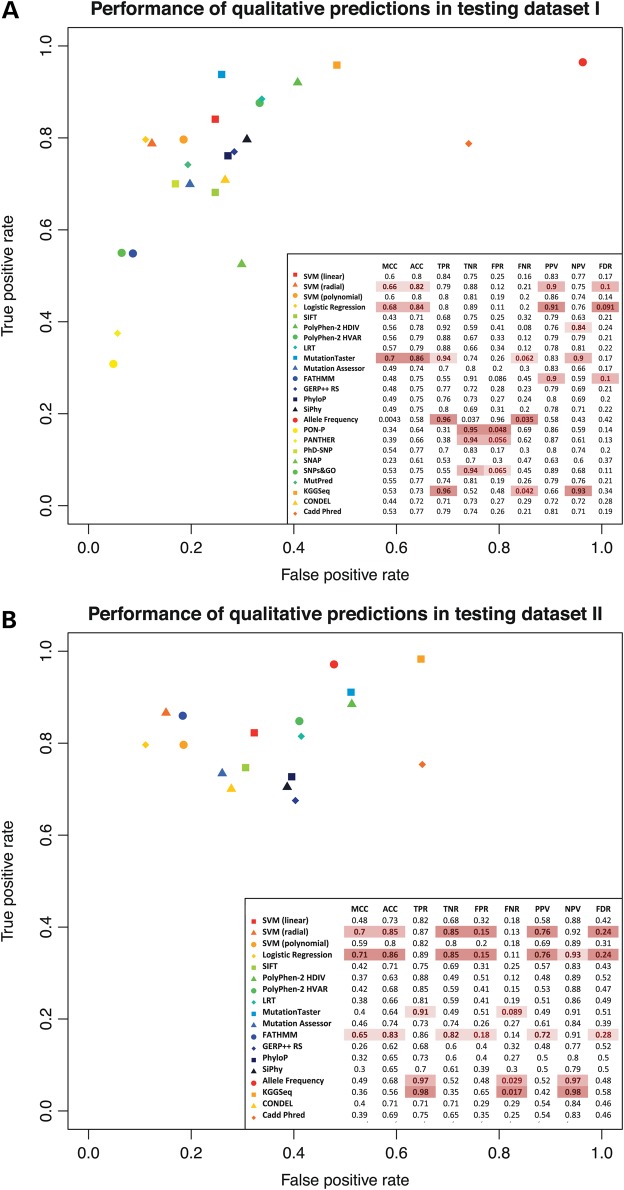
Accurate deleteriousness prediction for nonsynonymous variants is crucial for distinguishing pathogenic mutations from background polymorphisms in whole exome sequencing (WES) studies. Although many deleteriousness prediction methods have been developed, their prediction results are sometimes inconsistent with each other and their relative merits are still unclear in practical applications. To address these issues, we comprehensively evaluated the predictive performance of 18 current deleteriousness-scoring methods, including 11 function prediction scores (PolyPhen-2, SIFT, MutationTaster, Mutation Assessor, FATHMM, LRT, PANTHER, PhD-SNP, SNAP, SNPs&GO and MutPred), 3 conservation scores (GERP++, SiPhy and PhyloP) and 4 ensemble scores (CADD, PON-P, KGGSeq and CONDEL). We found that FATHMM and KGGSeq had the highest discriminative power among independent scores and ensemble scores, respectively. Moreover, to ensure unbiased performance evaluation of these prediction scores, we manually collected three distinct testing datasets, on which no current prediction scores were tuned. In addition, we developed two new ensemble scores that integrate nine independent scores and allele frequency. Our scores achieved the highest discriminative power compared with all the deleteriousness prediction scores tested and showed low false-positive prediction rate for benign yet rare nonsynonymous variants, which demonstrated the value of combining information from multiple orthologous approaches. Finally, to facilitate variant prioritization in WES studies, we have pre-computed our ensemble scores for 87 347 044 possible variants in the whole-exome and made them publicly available through the ANNOVAR software and the dbNSFP database.
© The Author 2014. Published by Oxford University Press. All rights reserved. For Permissions, please email: journals.permissions@oup.com.
Figures
Similar articles
-
REVEL: An Ensemble Method for Predicting the Pathogenicity of Rare Missense Variants.Am J Hum Genet. 2016 Oct 6;99(4):877-885. doi: 10.1016/j.ajhg.2016.08.016. Epub 2016 Sep 22. Am J Hum Genet. 2016. PMID: 27666373 Free PMC article.
-
dbNSFP v2.0: a database of human non-synonymous SNVs and their functional predictions and annotations.Hum Mutat. 2013 Sep;34(9):E2393-402. doi: 10.1002/humu.22376. Epub 2013 Jul 10. Hum Mutat. 2013. PMID: 23843252 Free PMC article.
-
dbNSFP v3.0: A One-Stop Database of Functional Predictions and Annotations for Human Nonsynonymous and Splice-Site SNVs.Hum Mutat. 2016 Mar;37(3):235-41. doi: 10.1002/humu.22932. Epub 2016 Jan 5. Hum Mutat. 2016. PMID: 26555599 Free PMC article.
-
dbNSFP v4: a comprehensive database of transcript-specific functional predictions and annotations for human nonsynonymous and splice-site SNVs.Genome Med. 2020 Dec 2;12(1):103. doi: 10.1186/s13073-020-00803-9. Genome Med. 2020. PMID: 33261662 Free PMC article.
-
Congruency in the prediction of pathogenic missense mutations: state-of-the-art web-based tools.Brief Bioinform. 2013 Jul;14(4):448-59. doi: 10.1093/bib/bbt013. Epub 2013 Mar 15. Brief Bioinform. 2013. PMID: 23505257 Review.
Cited by
-
Long-read sequencing and de novo assembly of a Chinese genome.Nat Commun. 2016 Jun 30;7:12065. doi: 10.1038/ncomms12065. Nat Commun. 2016. PMID: 27356984 Free PMC article.
-
Rheostat positions: A new classification of protein positions relevant to pharmacogenomics.Med Chem Res. 2020 Jul;29(7):1133-1146. doi: 10.1007/s00044-020-02582-9. Epub 2020 Jun 7. Med Chem Res. 2020. PMID: 32641900 Free PMC article.
-
In silico analyses of Wnt1 nsSNPs reveal structurally destabilizing variants, altered interactions with Frizzled receptors and its deregulation in tumorigenesis.Sci Rep. 2022 Sep 2;12(1):14934. doi: 10.1038/s41598-022-19299-x. Sci Rep. 2022. PMID: 36056132 Free PMC article.
-
Exploring the association of ESR1 and ESR2 gene SNPs with polycystic ovary syndrome in human females: a comprehensive association study.J Ovarian Res. 2024 Jan 29;17(1):27. doi: 10.1186/s13048-023-01335-7. J Ovarian Res. 2024. PMID: 38281964 Free PMC article.
-
Advantages and pitfalls of an extended gene panel for investigating complex neurometabolic phenotypes.Brain. 2016 Nov 1;139(11):2844-2854. doi: 10.1093/brain/aww221. Brain. 2016. PMID: 27604308 Free PMC article.
References
-
- Ng P.C., Henikoff S. (2006) Predicting the effects of amino acid substitutions on protein function. Annu. Rev. Genomics Hum. Genet., 7, 61–80. - PubMed
-
- Thusberg J., Vihinen M. (2009) Pathogenic or not? And if so, then how? Studying the effects of missense mutations using bioinformatics methods. Hum. Mutat., 30, 703–714. - PubMed
Publication types
MeSH terms
Grants and funding
LinkOut - more resources
Full Text Sources
Other Literature Sources
Miscellaneous
