

Refinement by shifting secondary structure elements improves sequence alignments
- PMID: 25546158
- PMCID: PMC4501258
- DOI: 10.1002/prot.24746
Refinement by shifting secondary structure elements improves sequence alignments
Abstract
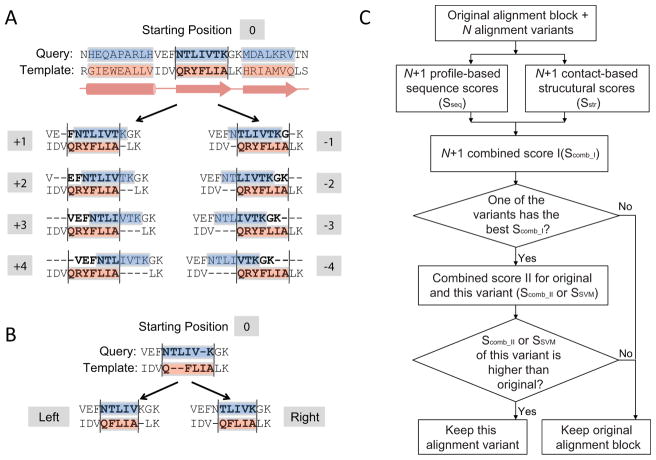
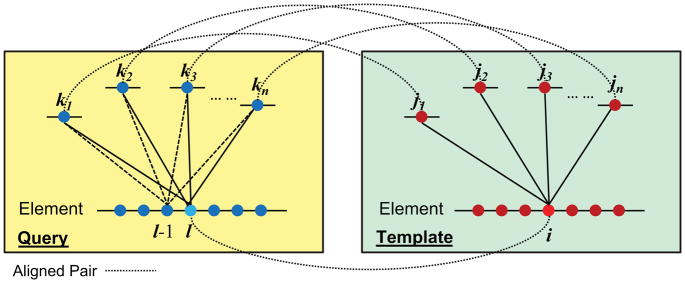
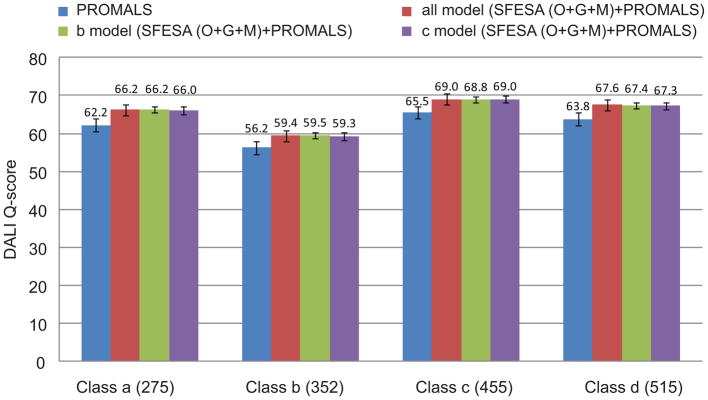
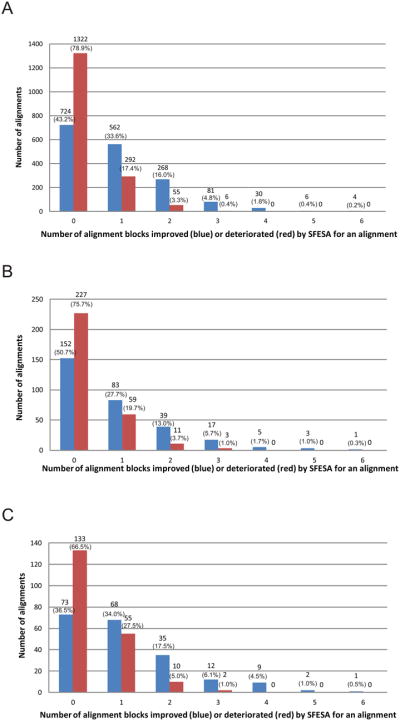
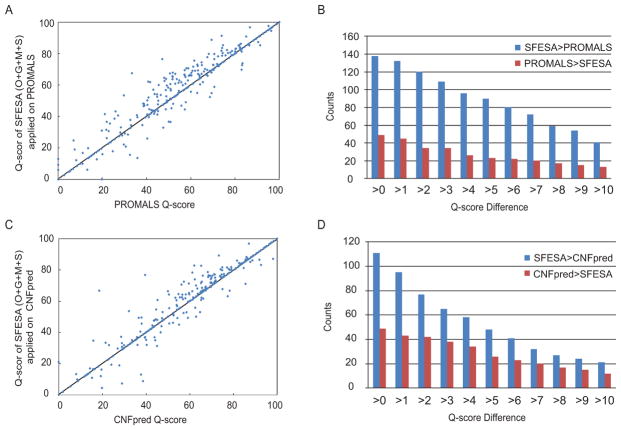
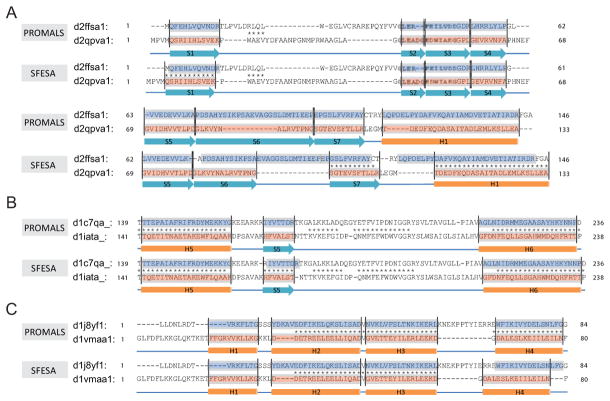
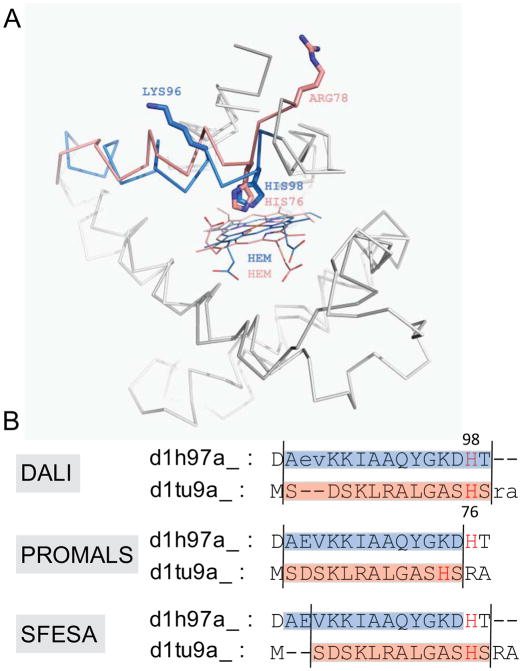
Constructing a model of a query protein based on its alignment to a homolog with experimentally determined spatial structure (the template) is still the most reliable approach to structure prediction. Alignment errors are the main bottleneck for homology modeling when the query is distantly related to the template. Alignment methods often misalign secondary structural elements by a few residues. Therefore, better alignment solutions can be found within a limited set of local shifts of secondary structures. We present a refinement method to improve pairwise sequence alignments by evaluating alignment variants generated by local shifts of template-defined secondary structures. Our method SFESA is based on a novel scoring function that combines the profile-based sequence score and the structure score derived from residue contacts in a template. Such a combined score frequently selects a better alignment variant among a set of candidate alignments generated by local shifts and leads to overall increase in alignment accuracy. Evaluation of several benchmarks shows that our refinement method significantly improves alignments made by automatic methods such as PROMALS, HHpred and CNFpred. The web server is available at http://prodata.swmed.edu/sfesa.
Keywords: alignment improvement; alignment refinement; contact energy; local secondary structure shifting; pairwise alignment.
© 2014 Wiley Periodicals, Inc.
Figures
Similar articles
-
SFESA: a web server for pairwise alignment refinement by secondary structure shifts.BMC Bioinformatics. 2015 Sep 3;16(1):282. doi: 10.1186/s12859-015-0711-0. BMC Bioinformatics. 2015. PMID: 26335387 Free PMC article.
-
PROMALS: towards accurate multiple sequence alignments of distantly related proteins.Bioinformatics. 2007 Apr 1;23(7):802-8. doi: 10.1093/bioinformatics/btm017. Epub 2007 Jan 31. Bioinformatics. 2007. PMID: 17267437
-
PROMALS web server for accurate multiple protein sequence alignments.Nucleic Acids Res. 2007 Jul;35(Web Server issue):W649-52. doi: 10.1093/nar/gkm227. Epub 2007 Apr 22. Nucleic Acids Res. 2007. PMID: 17452345 Free PMC article.
-
Methods for sequence-structure alignment.Methods Mol Biol. 2012;857:55-82. doi: 10.1007/978-1-61779-588-6_3. Methods Mol Biol. 2012. PMID: 22323217 Review.
-
Integrating protein secondary structure prediction and multiple sequence alignment.Curr Protein Pept Sci. 2004 Aug;5(4):249-66. doi: 10.2174/1389203043379675. Curr Protein Pept Sci. 2004. PMID: 15320732 Review.
Cited by
-
New structural insights reveal an expanded reaction cycle for inositol pyrophosphate hydrolysis by human DIPP1.FASEB J. 2021 Feb;35(2):e21275. doi: 10.1096/fj.202001489R. FASEB J. 2021. PMID: 33475202 Free PMC article.
-
PC_ali: a tool for improved multiple alignments and evolutionary inference based on a hybrid protein sequence and structure similarity score.Bioinformatics. 2023 Nov 1;39(11):btad630. doi: 10.1093/bioinformatics/btad630. Bioinformatics. 2023. PMID: 37847775 Free PMC article.
-
Asp1 from Schizosaccharomyces pombe binds a [2Fe-2S](2+) cluster which inhibits inositol pyrophosphate 1-phosphatase activity.Biochemistry. 2015 Oct 27;54(42):6462-74. doi: 10.1021/acs.biochem.5b00532. Epub 2015 Oct 9. Biochemistry. 2015. PMID: 26422458 Free PMC article.
-
SFESA: a web server for pairwise alignment refinement by secondary structure shifts.BMC Bioinformatics. 2015 Sep 3;16(1):282. doi: 10.1186/s12859-015-0711-0. BMC Bioinformatics. 2015. PMID: 26335387 Free PMC article.
References
-
- Baker D, Sali A. Protein structure prediction and structural genomics. Science. 2001;294(5540):93–96. - PubMed
Publication types
MeSH terms
Substances
Grants and funding
LinkOut - more resources
Full Text Sources
Other Literature Sources
