

Group 2 innate lymphoid cells promote beiging of white adipose tissue and limit obesity
- PMID: 25533952
- PMCID: PMC4447235
- DOI: 10.1038/nature14115
Group 2 innate lymphoid cells promote beiging of white adipose tissue and limit obesity
Abstract
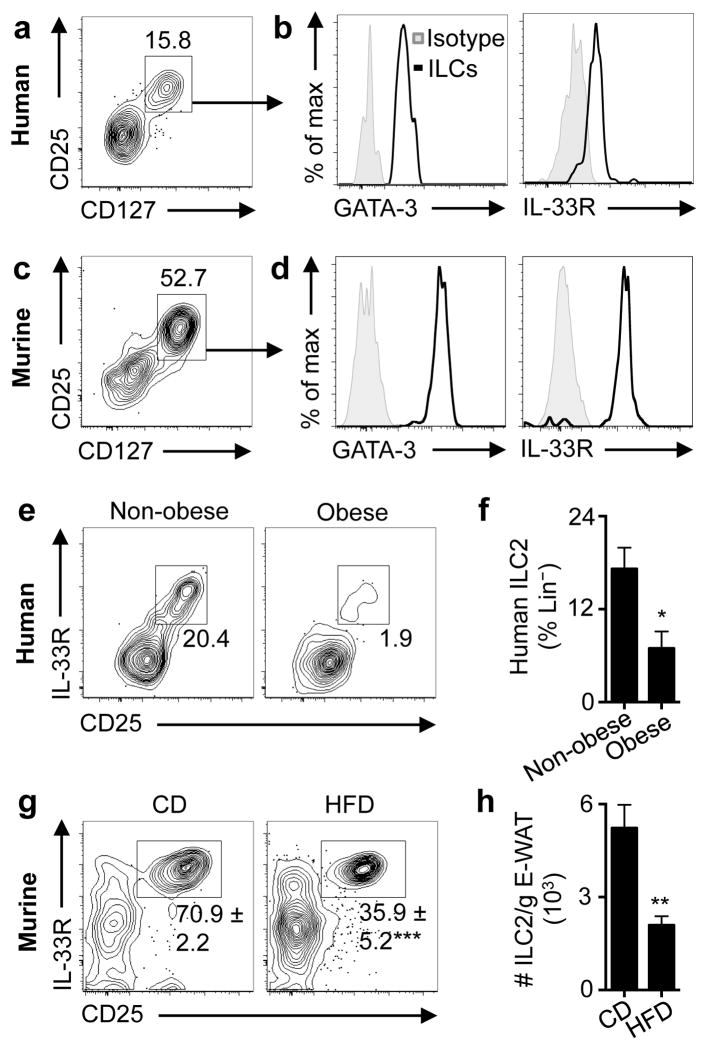
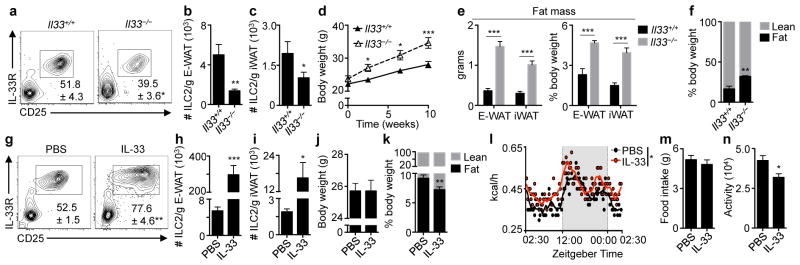
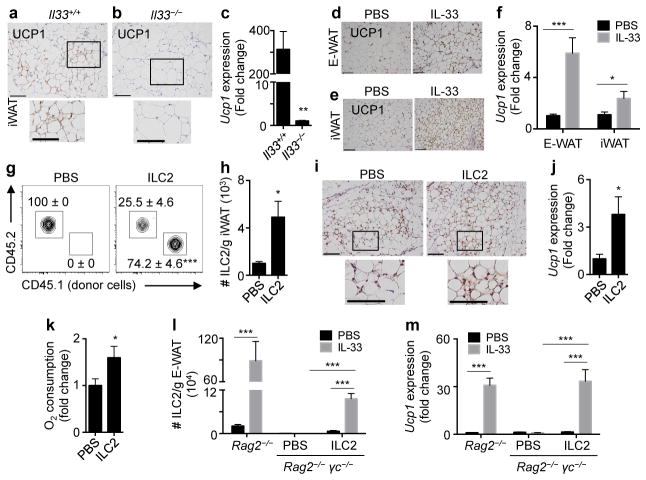
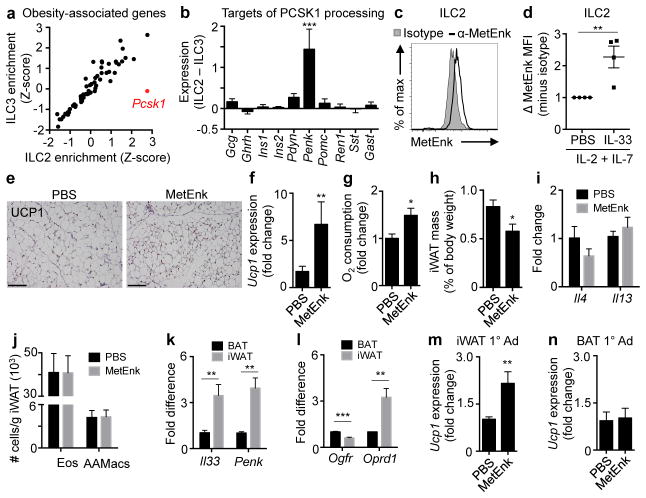
Obesity is an increasingly prevalent disease regulated by genetic and environmental factors. Emerging studies indicate that immune cells, including monocytes, granulocytes and lymphocytes, regulate metabolic homeostasis and are dysregulated in obesity. Group 2 innate lymphoid cells (ILC2s) can regulate adaptive immunity and eosinophil and alternatively activated macrophage responses, and were recently identified in murine white adipose tissue (WAT) where they may act to limit the development of obesity. However, ILC2s have not been identified in human adipose tissue, and the mechanisms by which ILC2s regulate metabolic homeostasis remain unknown. Here we identify ILC2s in human WAT and demonstrate that decreased ILC2 responses in WAT are a conserved characteristic of obesity in humans and mice. Interleukin (IL)-33 was found to be critical for the maintenance of ILC2s in WAT and in limiting adiposity in mice by increasing caloric expenditure. This was associated with recruitment of uncoupling protein 1 (UCP1)(+) beige adipocytes in WAT, a process known as beiging or browning that regulates caloric expenditure. IL-33-induced beiging was dependent on ILC2s, and IL-33 treatment or transfer of IL-33-elicited ILC2s was sufficient to drive beiging independently of the adaptive immune system, eosinophils or IL-4 receptor signalling. We found that ILC2s produce methionine-enkephalin peptides that can act directly on adipocytes to upregulate Ucp1 expression in vitro and that promote beiging in vivo. Collectively, these studies indicate that, in addition to responding to infection or tissue damage, ILC2s can regulate adipose function and metabolic homeostasis in part via production of enkephalin peptides that elicit beiging.
Conflict of interest statement
The authors declare no competing financial interests.
Figures
Comment in
-
Immunology: ILC2s regulate obesity and drive beiging of white adipose tissue.Nat Rev Endocrinol. 2015 Mar;11(3):131. doi: 10.1038/nrendo.2014.233. Epub 2014 Dec 23. Nat Rev Endocrinol. 2015. PMID: 25534196 No abstract available.
-
Immunometabolism. ILC2s skew the fat.Nat Rev Immunol. 2015 Feb;15(2):67. doi: 10.1038/nri3805. Epub 2014 Dec 30. Nat Rev Immunol. 2015. PMID: 25547848
-
White, brown, and beige; type 2 immunity gets hot.Immunity. 2015 Jan 20;42(1):15-7. doi: 10.1016/j.immuni.2015.01.001. Immunity. 2015. PMID: 25607455
-
Adipose tissue: ILC2 crank up the heat.Cell Metab. 2015 Feb 3;21(2):152-153. doi: 10.1016/j.cmet.2015.01.015. Cell Metab. 2015. PMID: 25651167
Similar articles
-
IL-33-driven ILC2/eosinophil axis in fat is induced by sympathetic tone and suppressed by obesity.J Endocrinol. 2016 Oct;231(1):35-48. doi: 10.1530/JOE-16-0229. J Endocrinol. 2016. PMID: 27562191 Free PMC article.
-
Immunology: ILC2s regulate obesity and drive beiging of white adipose tissue.Nat Rev Endocrinol. 2015 Mar;11(3):131. doi: 10.1038/nrendo.2014.233. Epub 2014 Dec 23. Nat Rev Endocrinol. 2015. PMID: 25534196 No abstract available.
-
Stimulation of mitochondrial oxidative capacity in white fat independent of UCP1: a key to lean phenotype.Biochim Biophys Acta. 2013 May;1831(5):986-1003. doi: 10.1016/j.bbalip.2013.02.003. Epub 2013 Feb 20. Biochim Biophys Acta. 2013. PMID: 23454373
-
Beiging of white adipose tissue as a therapeutic strategy for weight loss in humans.Horm Mol Biol Clin Investig. 2017 Jun 23;31(2):/j/hmbci.2017.31.issue-2/hmbci-2017-0016/hmbci-2017-0016.xml. doi: 10.1515/hmbci-2017-0016. Horm Mol Biol Clin Investig. 2017. PMID: 28672737 Review.
-
Exercise Effects on White Adipose Tissue: Beiging and Metabolic Adaptations.Diabetes. 2015 Jul;64(7):2361-8. doi: 10.2337/db15-0227. Epub 2015 Jun 7. Diabetes. 2015. PMID: 26050668 Free PMC article. Review.
Cited by
-
Roles of innate lymphoid cells (ILCs) in allergic diseases: The 10-year anniversary for ILC2s.J Allergy Clin Immunol. 2021 May;147(5):1531-1547. doi: 10.1016/j.jaci.2021.03.015. J Allergy Clin Immunol. 2021. PMID: 33965091 Free PMC article. Review.
-
Obesity and adipose tissue impact on T-cell response and cancer immune checkpoint blockade therapy.Immunother Adv. 2022 Jun 24;2(1):ltac015. doi: 10.1093/immadv/ltac015. eCollection 2022. Immunother Adv. 2022. PMID: 36033972 Free PMC article. Review.
-
Polarization of Immune Cells in the Pathologic Response to Inhaled Particulates.Front Immunol. 2020 Jun 17;11:1060. doi: 10.3389/fimmu.2020.01060. eCollection 2020. Front Immunol. 2020. PMID: 32625201 Free PMC article. Review.
-
Metabolic activity of brown, "beige," and white adipose tissues in response to chronic adrenergic stimulation in male mice.Am J Physiol Endocrinol Metab. 2016 Jul 1;311(1):E260-8. doi: 10.1152/ajpendo.00545.2015. Epub 2016 May 3. Am J Physiol Endocrinol Metab. 2016. PMID: 27143559 Free PMC article.
-
SnapShot: Brown and Beige Adipose Thermogenesis.Cell. 2016 Jun 30;166(1):258-258.e1. doi: 10.1016/j.cell.2016.06.038. Cell. 2016. PMID: 27368105 Free PMC article.
References
-
- Osborn O, Olefsky JM. The cellular and signaling networks linking the immune system and metabolism in disease. Nature medicine. 2012;18:363–374. - PubMed
-
- Moro K, et al. Innate production of T(H)2 cytokines by adipose tissue-associated c-Kit(+)Sca-1(+) lymphoid cells. Nature. 2010;463:540–544. - PubMed
Publication types
MeSH terms
Substances
Grants and funding
- R01 AI074878/AI/NIAID NIH HHS/United States
- K08 AR065577/AR/NIAMS NIH HHS/United States
- T32-AI060516/AI/NIAID NIH HHS/United States
- P01AI06697/AI/NIAID NIH HHS/United States
- F32 DK105743/DK/NIDDK NIH HHS/United States
- F30-AI112023/AI/NIAID NIH HHS/United States
- R01 AI095466/AI/NIAID NIH HHS/United States
- AI061570/AI/NIAID NIH HHS/United States
- P01 AI106697/AI/NIAID NIH HHS/United States
- P30 DK050306/DK/NIDDK NIH HHS/United States
- T32 AI007532/AI/NIAID NIH HHS/United States
- F31AG047003/AG/NIA NIH HHS/United States
- KL2-RR024132/RR/NCRR NIH HHS/United States
- AI102942/AI/NIAID NIH HHS/United States
- F30 AI112023/AI/NIAID NIH HHS/United States
- DP5OD012116/OD/NIH HHS/United States
- DP5 OD012116/OD/NIH HHS/United States
- AI074878/AI/NIAID NIH HHS/United States
- T32-AI007532/AI/NIAID NIH HHS/United States
- F31 AG047003/AG/NIA NIH HHS/United States
- DP2 OD007288/OD/NIH HHS/United States
- T32 AI060516/AI/NIAID NIH HHS/United States
- 2-P30 CA016520/CA/NCI NIH HHS/United States
- DP2OD007288/OD/NIH HHS/United States
- R01 AI102942/AI/NIAID NIH HHS/United States
- P30 AR057217/AR/NIAMS NIH HHS/United States
- KL2 RR024132/RR/NCRR NIH HHS/United States
- T32 AR007465/AR/NIAMS NIH HHS/United States
- AI095608/AI/NIAID NIH HHS/United States
- P30 CA016520/CA/NCI NIH HHS/United States
- P30DK19525/DK/NIDDK NIH HHS/United States
- P30-DK050306/DK/NIDDK NIH HHS/United States
- U01 AI095608/AI/NIAID NIH HHS/United States
- R01 AI061570/AI/NIAID NIH HHS/United States
- R01 AI097333/AI/NIAID NIH HHS/United States
- AI095466/AI/NIAID NIH HHS/United States
- P30 DK019525/DK/NIDDK NIH HHS/United States
- AI097333/AI/NIAID NIH HHS/United States
LinkOut - more resources
Full Text Sources
Other Literature Sources
Medical
Molecular Biology Databases
Research Materials
