. 2014 Dec 24;9(6):2304-16.
doi: 10.1016/j.celrep.2014.11.042. Epub 2014 Dec 18.

Channelrhodopsin-assisted patching: in vivo recording of genetically and morphologically identified neurons throughout the brain

Affiliations

Channelrhodopsin-assisted patching: in vivo recording of genetically and morphologically identified neurons throughout the brain

William Muñoz et al. Cell Rep. .

Abstract

Brain networks contain a large diversity of functionally distinct neuronal elements, each with unique properties, enabling computational capacities and supporting brain functions. Understanding their functional implications for behavior requires the precise identification of the cell types of a network and in vivo monitoring of their activity profiles. Here, we developed a channelrhodopsin-assisted patching method allowing the efficient in vivo targeted recording of neurons identified by their molecular, electrophysiological, and morphological features. The method has a high yield, does not require visual guidance, and thus can be applied at any depth in the brain. This approach overcomes limitations of present technologies. We validate this strategy with in vivo recordings of identified subtypes of GABAergic and glutamatergic neurons in deep cortical layers, subcortical cholinergic neurons, and neurons in the thalamic reticular nucleus in anesthetized and awake mice. We propose this method as an important complement to existing technologies to relate specific cell-type activity to brain circuitry, function, and behavior.


Figures

Figure 1
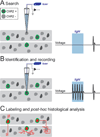
Figure 1. Strategy for in vivo recording and labeling of genetically defined cell types in the brain
The conditional expression of ChR2 in cell types of interest renders genetically defined neurons within a network responsive to light, which can be exploited for their identification. (A) Employing the standard blind patching approach, glass electrodes (carrying an optical fiber inside for light stimulus delivery) are slowly advanced within the structure of interest until a cell is encountered. (B) ChR2-expressing cells fire reliable, time-locked spikes, upon light stimulation (right). Once a ChR2-expressing cell has been identified, its activity profile can be studied. (C) ChR2-expressing cells are labeled with neurobiotin, and post hoc histological analysis is employed to study its morphology (e.g., axonal projection patterns) and precise anatomical localization (e.g., layer, column, nucleus, etc.).
Figure 2
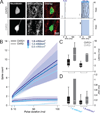
Figure 2. Optical activation of genetically defined, ChR2-expressing neurons
(A) Cone of blue light emitted by the optical fiber (blue false color) located inside of the glass pipette. Right top, cross-sectional light intensity profile (source: blue 473 nm laser light) at the pipette tip, estimated from the light power measured along the gray plane in the left image (75 mW·mm−2 at tip of fiber). Right bottom, estimation of light intensity at the tip of pipette inside the brain. Light intensity is corrected for power attenuation due to scattering, geometric dispersion and distance from light source (Stark et al., 2012). (B) Representative example of light-evoked activity for a post hoc histologically verified ChR2-expressing cortical interneuron in the PV-Cre driver line. Left, fluorescence and merged images of the neurobiotin staining and ChR2 expression of the recorded cell. Right top, spontaneous (black) and light-evoked (light blue) spike waveforms are highly correlated (Pearson correlation coefficient, r = 0.997). Raster (middle) and peristimulus histogram of spike probability (bottom; bin: 1 ms) for 20 trials of light stimulation of the recorded cell. Blue shaded area represents light stimulus. (C–D) Z-scored peristimulus histograms, latency and jitter to first spike of all histologically verified ChR2-expressing cells in the PV, SST and CHAT Cre driver lines. Light stimulation intensity (at pipette tip): 0.9–1.4 mW·mm−2. Box plot central bar represents the median, and edges represent the 25th and 75th percentiles of the data set. Blue horizontal line represents light stimulus.
Figure 3
Figure 3. Varying light stimulus duration disambiguates ChR2-expressing glutamatergic and synaptically driven neurons
(A) Left, example of histological confirmation of a recorded ChR2-expressing (top) and a ChR2-negative (bottom) glutamatergic neocortical Thy1 pyramidal neurons. Right, raster of light-evoked activity of corresponding cells for 5 and 100 ms light pulses (tip intensity: 1.4 mW/mm2). (B) While histologically confirmed ChR2-expressing (n = 6) and ChR2-negative (n=4) cells show similar response magnitude to brief (5–10 ms) light stimulation, only ChR2-expressing cells fire continuously during pulses of longer duration (50–100 ms). (C) Population latency of first light-evoked spike of ChR2-expressing neurons shows a trend for shorter values, although these do not clearly segregate from ChR2-negative group values. (D) Population jitter values of first light-evoked spike of ChR2-expressing and ChR2-negative neurons are small and overlap significantly.
Figure 4
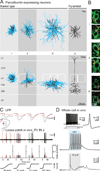
Figure 4. Morphological and functional characterization of cortical PV neurons
(A) Top and side perspectives of the morphology of PV INs and thick-tufted pyramidal cell (beige: somas, black: dendrites, blue: axons). For illustrative purpose, laminar and columnar positions and sizes of morphologies where proportionally adjusted to fit a background prototypical barrel cortex of 1 mm thick from pia to white matter; barrels have been outlined from multiple histological sections containing and flanking somatic position. Only dendrites are shown for cell iv. (B) Basket terminals of labeled cells i–iii (red) show multiple axonal varicosities (arrowheads) in the vicinity of somas of neighboring ChR2-expressing unrecorded cells (green, two examples per filled neuron). (C) Example of sensory responses of a morphologically identified PV-expressing basket cell (cell ii in panel A) of the primary somatosensory cortex. C1 (black traces) and gamma (red traces) whiskers were deflected caudally (black) at varying velocities (26–187 mm/s) while simultaneously monitoring whisker-evoked LFP (position: ~500 µm deep, presumed layer 4, and ~200–250 µm laterally from the cell ii recording site) and recording the spiking activity of basket cell ii in the loose-patch configuration. (D) Intracellular recording of a fast spiking neuron in the primary somatosensory cortex. Top, firing pattern (left) and spike waveform (right) in response to intracellular current injections. Middle, light-evoked depolarization and spiking of the recorded cell (blue shaded region represents light stimulus). Bottom, membrane potential fluctuations in response to a whisker pad air puff (gray shaded region represents the 100 ms, 20 psi air puff, delivered over the C and D whisker rows).
Figure 5
Figure 5. Morphological and functional characterization of SST-expressing INs
(A) Top and side perspectives of the morphology of SST INs and a spiny bipolar neuron (beige: somas, black: dendrites, red: axons). Both Martinotti and non-Martinotti cells are shown (see text for definition). (B) Top, 3D rendition of spiny bipolar cell v showing intracortical and striatal axonal arbor. All of the intracortical axon was located in infragranular layers. (A, anterior, M, medial, D, dorsal). Bottom, top view (normal to pia) of the same cell showing anterodorsal and mediolateral span of the axon (beige: soma, black: dendrites, red: axon). (C) Spontaneous activity of morphologically identified SST-expressing, non-Martinotti cortical interneuron iv (top) and simultaneous LFP recording in awake, head-restrained mouse.
Figure 6
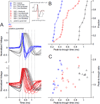
Figure 6. Comparison of spike waveform properties of genetically and morphologically identified cortical neurons
(A) Normalized spike waveforms of all genetically and morphologically identified cortical neurons in the PV and SST Cre driver lines compared to putative pyramidal regular spiking cells recorded blindly (range: 350–1100 µm below pia, presumed layers 2/3–6). (B) Cumulative plot of peak-to-trough times of PV and SST subtypes and putative pyramidal cells and (C) comparison of peak-to-trough time and voltage ratios. Note that although PV and regular spiking putative pyramidal cells have narrow and mutually exclusive distributions, SST neurons have widespread and roughly continuous distribution with significant overlap with PV distribution. Also note that while SST spiny bipolar cells (red triangles) are similar to regular spiking cells, PV pyramidal cells (blue triangles) are hardly distinguishable from some PV basket cells (blue squares). Basket, Martinotti, non-Martinotti, spiny bipolar, and pyramidal cells were identified according to morphological criteria (see text). Non-pyramidal cells are histologically confirmed cells lacking apical dendrite and dendritic spines in which not enough axonal information was available for clear morphological assignment. Non-identified cells are histologically confirmed cells where only the soma was recovered.
Figure 7
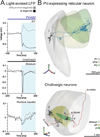
Figure 7. Recording and labeling of genetically defined cell types in several subcortical structures
(A) A combination of stereotaxic procedures with mapping of light-evoked LFP can be exploited to pinpoint the location of structures of interest, such as reticular nucleus of the thalamus (RT) (top), the striatum (middle), and the cholinergic nucleus basalis (bottom). Note the large sustained or transient light-evoked field potentials at the site where genetically defined cells have subsequently been recorded and labeled (black traces), and how it evolves from what is observed at a distal, more superficial recording location (grey traces). Blue shaded area represents light stimulation. (B) Top, 3D rendition of the somatodendritic (black) and axonal (blue) projections of a GABAergic neuron of the thalamic reticular nucleus in the PV Cre driver line (A, anterior, M, medial, D, dorsal). Bottom, 3D rendition of somatodendritic and axonal projections of cholinergic neurons of the striatum (ii), nucleus basalis (iii and v), and zona incerta (iv) in the CHAT Cre driver line.

Similar articles

Cited by

References

    1. Adesnik H, Bruns W, Taniguchi H, Huang ZJ, Scanziani M. A neural circuit for spatial summation in visual cortex. Nature. 2012;490:226–231. - PMC - PubMed
    1. Andermann ML, Gilfoy NB, Goldey GJ, Sachdev RN, Wolfel M, Mccormick DA, Reid RC, Levene MJ. Chronic cellular imaging of entire cortical columns in awake mice using microprisms. Neuron. 2013;80:900–913. - PMC - PubMed
    1. Andjelic S, Gallopin T, Cauli B, Hill EL, Roux L, Badr S, Hu E, Tamas G, Lambolez B. Glutamatergic nonpyramidal neurons from neocortical layer VI and their comparison with pyramidal and spiny stellate neurons. J Neurophysiol. 2009;101:641–654. - PMC - PubMed
    1. Anikeeva P, Andalman AS, Witten I, Warden M, Goshen I, Grosenick L, Gunaydin LA, Frank LM, Deisseroth K. Optetrode: a multichannel readout for optogenetic control in freely moving mice. Nat Neurosci. 2012;15:163–170. - PMC - PubMed
    1. Burgalossi A, Herfst L, Von Heimendahl M, Forste H, Haskic K, Schmidt M, Brecht M. Microcircuits of functionally identified neurons in the rat medial entorhinal cortex. Neuron. 2011;70:773–786. - PubMed

Publication types

Substances

LinkOut - more resources