The RNA-binding protein Arrest (Bruno) regulates alternative splicing to enable myofibril maturation in Drosophila flight muscle
- PMID: 25532219
- PMCID: PMC4328745
- DOI: 10.15252/embr.201439791
The RNA-binding protein Arrest (Bruno) regulates alternative splicing to enable myofibril maturation in Drosophila flight muscle
Abstract
In Drosophila, fibrillar flight muscles (IFMs) enable flight, while tubular muscles mediate other body movements. Here, we use RNA-sequencing and isoform-specific reporters to show that spalt major (salm) determines fibrillar muscle physiology by regulating transcription and alternative splicing of a large set of sarcomeric proteins. We identify the RNA-binding protein Arrest (Aret, Bruno) as downstream of salm. Aret shuttles between the cytoplasm and nuclei and is essential for myofibril maturation and sarcomere growth of IFMs. Molecularly, Aret regulates IFM-specific splicing of various salm-dependent sarcomeric targets, including Stretchin and wupA (TnI), and thus maintains muscle fiber integrity. As Aret and its sarcomeric targets are evolutionarily conserved, similar principles may regulate mammalian muscle morphogenesis.
Keywords: Arrest; Drosophila; alternative splicing; flight muscle; myofibril.
© 2014 The Authors. Published under the terms of the CC BY NC ND 4.0 license.
Figures
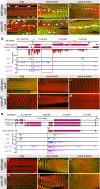
Wild-type fibrillar IFMs (A) and tubular leg (B) and jump muscles (TDT) (C). Knock down of salm leads to tubular conversion of the IFMs (D), leg and jump muscles are unaffected (E, F).
mRNA-Seq read counts showing expression of Strn-Mlck (G–M) and kettin isoforms (N–T) from wild-type IFMs, leg muscle and jump muscle as well as salm-IR or salmFRT conditional mutant IFMs (G, N), and by genomic GFP-tagged isoform markers in Strn-Mlck (H–M) and kettin (O–T). Note that the IFM-specific expression of Strn-Mlck-IsoR depends on salm (compare H and K), whereas the tubular muscle-specific Kettin-IsoA/D is gained in IFMs upon loss of salm (compare O and R). Insertion of the GFP tag is indicated by green arrows in G and N. Hairpin sequence of Strn-Mlck-IR and the MiMIC insertion site are marked in G. Note the fibrillar-specific exons marked with green boxes (G, N) and the tubular-specific exons in Strn-Mlck marked by a red box (G).
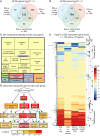
Venn diagram comparing significantly differentially expressed (P-value < 0.05, DESeq2) genes whose log2-fold changes are greater than 2 (log2FC > 2). Note that expression of 133 IFM-specific genes is salm dependent.
Venn diagram comparing significantly differentially expressed (P-value < 0.05, DEXSeq) exons with log2FC > 2. Note that expression of most IFM-specific exons is salm dependent (n = 794). These exons combined with the genes in (A) define the core group of fibrillar-specific genes.
REVIGO treemap of GO component analysis of the 703 core fibrillar genes versus all expressed genes showing enrichment for muscle, mitochondrial, and cytoskeletal terms.
Tree of selected GOrilla GO component terms highlighting enrichment of muscle structural components.
Hierarchical clustering of log2FC of all 319 exons from 53 sarcomeric genes that are significantly differentially expressed (P-value < 0.05, DEXSeq) comparing their expression in IFMs to entire legs, jump muscles, salm-IR IFMs or aret-IR IFMs. Exons cluster into ‘fibrillar exons’ (shown in reds) which are IFM specific and mostly salm dependent and ‘tubular exons’ (shown in blues). Black dots on right demark location of individual sarcomeric gene exons in the heatmap. Note that individual sarcomeric genes have both tubular- and fibrillar-specific exon expression.

Developmental mRNA-SEQ analysis of aret expression in IFMs, leg muscle and jump muscle. aret mRNA is strongly expressed at 30 h APF and expression continues in adult IFMs, but not in leg or jump muscles. aretIR hairpin sequences are indicated.
Aret protein localizes to IFM nuclei (B) but not to leg muscle (C) or jump muscle nuclei (D) in adults. Both aret mRNA and protein expression depend on salm (A, E). Scale bar are 5 μm.
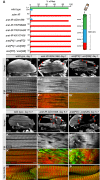
Flight tests of various aret-specific RNAi hairpins and trans-heterozygous aret mutant combinations.
Hemithoraces (B–D) and IFM myofibrils (E–G) from young (day 1) wild-type (B, E), aret-IR (C, F), or aret mutants (D, G). Note the thinner or ruptured IFM fibers upon aret removal (C, D, red arrow heads) and the shorter or entirely disrupted sarcomeres (F, G compare to E). Scale bars are 100 μm in (B–D).
Hemithoraces (H–J) and IFM myofibrils (K–M) of aged adults (5–7 days) from wild-type, aret-IR, or aret mutants. Note the severe IFM fiber disruption (I, J, red arrow heads) and the severe myofibril and sarcomere defects upon aret removal (L, M compared to K). Leg muscles are unaffected (N–P). Scale bars are 100 μm (H–J), and 5 μm (E–G) and (K–P).
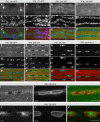
Aret protein is concentrated in sub-nuclear locations of the larval IFM template muscles at 14 h APF (red arrow heads in A). Aret protein is barely detectable at 17 h APF and its levels increase until 60 h APF, during which time Aret is located in close proximity to the nuclei and throughout the IFM cytoplasm (B–F). Aret protein is found in the nuclei at 72 h APF (G) and in adult IFMs (H). Scale bars are 5 μm.
Co-stain of Aret and nuclear Lamin reveals some Aret in the nuclei at 48 h APF (I), whereas most of Aret is nuclear at 72 h APF (J). Scale bars are 5 μm.

Developing myofibrils and sarcomeres in wild-type (A–D) and aret-IR pupae (E–H) stained with phalloidin. Intensity plots 10 μm in length within one representative myofibril (A'–H'). Regular sarcomeres of about 2 μm at 48 h APF in wild-type (B) mature to about 3.3 μm at 90 h APF (D). aret-IR myofibrils and sarcomeres are present at approximately the normal length at 48 h APF (F) but fail to elongate until 90 h APF (G, H). Scale bars are 5 μm.
Quantification of sarcomere length in wild-type (blue) and aret-IR (red), ***P < 0.001, unpaired Student's t-test. Standard deviation is shown.
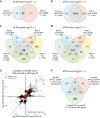
Venn diagram comparing significantly differentially expressed (P-value < 0.05, DESeq2) genes with a log2FC > 2 between aret-IR and salm-IR. 51 genes are co-regulated by Salm and Aret.
Venn diagram comparing significantly differentially expressed (P-value < 0.05, DEXSeq) exons with log2FC > 2 between aret-IR and salm-IR. Note that expression of 78.6% (1119/1423) of Salm-dependent exons is also Aret dependent.
Venn diagram comparing significantly differentially expressed (P-value < 0.05, DESeq2) genes with a log2FC > 2 between IFM:aret-IR, IFM:salm-IR, IFM:leg, and IFM:jump muscle. Only 24 fibrillar-specific genes are co-regulated by Salm and Aret.
Venn diagram comparing significantly differentially expressed (P-value < 0.05, DEXSeq) exons with log2FC > 2 between IFM:aret-IR, IFM:salm-IR, IFM:leg, and IFM:jump muscle. 747 fibrillar-specific exons co-depend on Aret and Salm.
Correlation plot of the log2FC IFM:salm-IR versus IFM:aret-IR. All significantly differentially expressed exons (n = 5939, P-value < 0.05, DEXSeq) are plotted in black, while sarcomeric protein exons are plotted in red. Pearson's correlation coefficients for all exons (black) and the sarcomeric exons subset (red) are indicated. Note that many exons are co-regulated by both Salm and Aret and that Aret promotes both inclusion and exclusion of exons.
Venn diagram comparing significantly differentially expressed (P-value < 0.05, DEXSeq) exons with log2FC > 2 between WT IFM:aret-IR IFM at 30 h APF, 72 h APF and in 1-d adults. Notably, 781 exons (491 uniquely) are regulated at the adult time point, while only ˜300 exons are regulated at each developmental time point.
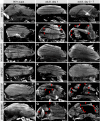
Hemithoraces of 90 h APF pupae (A, D, G, J), 1-day adults (B, E, H, K) and 5–7 days aged adults (C, F, I, L). Wild-type IFM fibers remain intact in aged adults (A–C), whereas aret-IR fibers are successively ruptured and lost (D–F, red arrow heads). This fiber loss is entirely suppressed upon removal of Mhc function from aret-IR IFMs using the Mhc [10] allele (G–L). Scale bars are 100 μm.
Hemithoraces of IFM-specific Strn-Mlck knock down 90 h APF pupae (M), 1 day (N) and 5–7 days adults (O) and Strn-Mlck MiMIC [MI02893] 90 h APF (P), 1 day (Q) and 5–7 days adults (R). Note the progressive fiber degeneration upon aging (M–R, red arrow heads). Scale bars are 100 μm.
Similar articles
-
Arrest is a regulator of fiber-specific alternative splicing in the indirect flight muscles of Drosophila.J Cell Biol. 2014 Sep 29;206(7):895-908. doi: 10.1083/jcb.201405058. Epub 2014 Sep 22. J Cell Biol. 2014. PMID: 25246617 Free PMC article.
-
Bruno 1/CELF regulates splicing and cytoskeleton dynamics to ensure correct sarcomere assembly in Drosophila flight muscles.PLoS Biol. 2024 Apr 29;22(4):e3002575. doi: 10.1371/journal.pbio.3002575. eCollection 2024 Apr. PLoS Biol. 2024. PMID: 38683844 Free PMC article.
-
Rbfox1 is required for myofibril development and maintaining fiber type-specific isoform expression in Drosophila muscles.Life Sci Alliance. 2022 Jan 7;5(4):e202101342. doi: 10.26508/lsa.202101342. Print 2022 Apr. Life Sci Alliance. 2022. PMID: 34996845 Free PMC article.
-
Genetics of the Drosophila flight muscle myofibril: a window into the biology of complex systems.Bioessays. 2001 Nov;23(11):1047-63. doi: 10.1002/bies.1150. Bioessays. 2001. PMID: 11746221 Review.
-
Promiscuity in post-transcriptional control of gene expression: Drosophila sex-lethal and its regulatory partnerships.FEBS Lett. 2017 Jun;591(11):1471-1488. doi: 10.1002/1873-3468.12652. Epub 2017 Apr 28. FEBS Lett. 2017. PMID: 28391641 Free PMC article. Review.
Cited by
-
Identification of evolutionarily conserved regulators of muscle mitochondrial network organization.Nat Commun. 2022 Nov 4;13(1):6622. doi: 10.1038/s41467-022-34445-9. Nat Commun. 2022. PMID: 36333356 Free PMC article.
-
The actin polymerization factor Diaphanous and the actin severing protein Flightless I collaborate to regulate sarcomere size.Dev Biol. 2021 Jan 1;469:12-25. doi: 10.1016/j.ydbio.2020.09.014. Epub 2020 Sep 25. Dev Biol. 2021. PMID: 32980309 Free PMC article.
-
Tagging Drosophila Proteins with Genetically Encoded Fluorophores.Methods Mol Biol. 2022;2540:251-268. doi: 10.1007/978-1-0716-2541-5_12. Methods Mol Biol. 2022. PMID: 35980582
-
A Large Scale Systemic RNAi Screen in the Red Flour Beetle Tribolium castaneum Identifies Novel Genes Involved in Insect Muscle Development.G3 (Bethesda). 2019 Apr 9;9(4):1009-1026. doi: 10.1534/g3.118.200995. G3 (Bethesda). 2019. PMID: 30733381 Free PMC article.
-
A genome-wide resource for the analysis of protein localisation in Drosophila.Elife. 2016 Feb 20;5:e12068. doi: 10.7554/eLife.12068. Elife. 2016. PMID: 26896675 Free PMC article.
References
-
- Schiaffino S, Reggiani C. Fiber types in mammalian skeletal muscles. Physiol Rev. 2011;91:1447–1531. - PubMed
-
- Linke WA, Kulke M, Li H, Fujita-Becker S, Neagoe C, Manstein DJ, Gautel M, Fernandez JM. PEVK domain of titin: an entropic spring with actin-binding properties. J Struct Biol. 2002;137:194–205. - PubMed
-
- Lehmann F, Dickinson M. The changes in power requirements and muscle efficiency during elevated force production in the fruit fly Drosophila melanogaster. J Exp Biol. 1997;200:1133. - PubMed
-
- Josephson R. Comparative physiology of insect flight muscle. In: Vigoreaux J, editor. Nature's Versatile Engine: Insect Flight Muscle Inside and Out. Georgetown, TX: Landes Bioscience; 2006. pp. 35–43.
Publication types
MeSH terms
Substances
Grants and funding
LinkOut - more resources
Full Text Sources
Other Literature Sources
Molecular Biology Databases
Research Materials

