. 2014 Dec 20:2:179.
doi: 10.1186/s40478-014-0178-7.

Glucose transporter 3 is a rab11-dependent trafficking cargo and its transport to the cell surface is reduced in neurons of CAG140 Huntington's disease mice

Affiliations

Glucose transporter 3 is a rab11-dependent trafficking cargo and its transport to the cell surface is reduced in neurons of CAG140 Huntington's disease mice

Hollis McClory et al. Acta Neuropathol Commun. .

Abstract

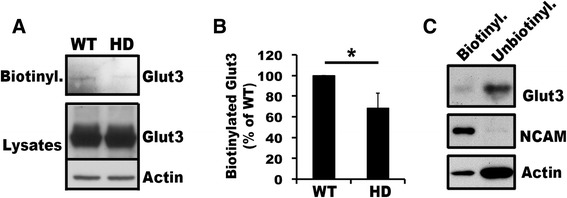
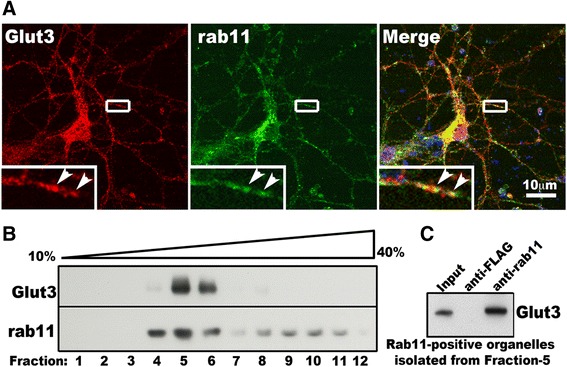
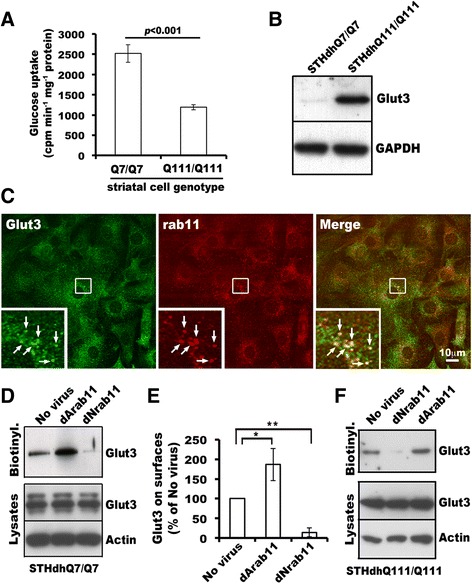
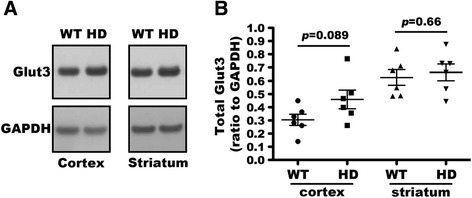
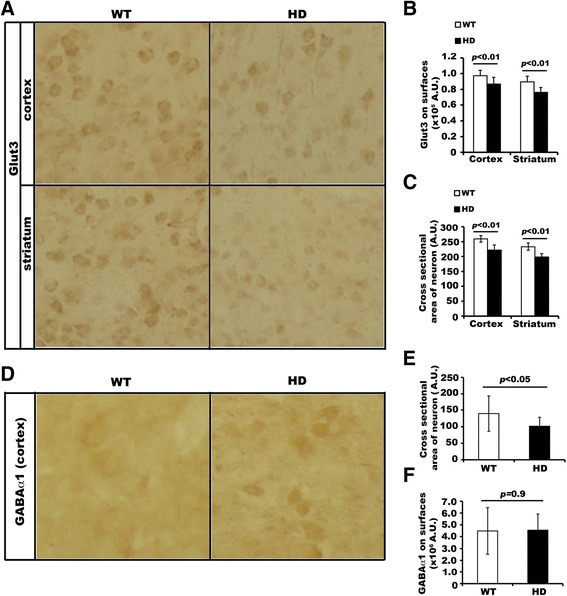
Huntington's disease (HD) disturbs glucose metabolism in the brain by poorly understood mechanisms. HD neurons have defective glucose uptake, which is attenuated upon enhancing rab11 activity. Rab11 regulates numerous receptors and transporters trafficking onto cell surfaces; its diminished activity in HD cells affects the recycling of transferrin receptor and neuronal glutamate/cysteine transporter EAAC1. Glucose transporter 3 (Glut3) handles most glucose uptake in neurons. Here we investigated rab11 involvement in Glut3 trafficking. Glut3 was localized to rab11 positive puncta in primary neurons and immortalized striatal cells by immunofluorescence labeling and detected in rab11-enriched endosomes immuno-isolated from mouse brain by Western blot. Expression of dominant active and negative rab11 mutants in clonal striatal cells altered the levels of cell surface Glut3 suggesting a regulation by rab11. About 4% of total Glut3 occurred at the cell surface of primary WT neurons. HD(140Q/140Q) neurons had significantly less cell surface Glut3 than did WT neurons. Western blot analysis revealed comparable levels of Glut3 in the striatum and cortex of WT and HD(140Q/140Q) mice. However, brain slices immunolabeled with an antibody recognizing an extracellular epitope to Glut3 showed reduced surface expression of Glut3 in the striatum and cortex of HD(140Q/140Q) mice compared to that of WT mice. Surface labeling of GABAα1 receptor, which is not dependent on rab11, was not different between WT and HD(140Q/140Q) mouse brain slices. These data define Glut3 to be a rab11-dependent trafficking cargo and suggest that impaired Glut3 trafficking arising from rab11 dysfunction underlies the glucose hypometabolism observed in HD.


Figures

Figure 1
Figure 1
Impaired trafficking of Glut3 to cell surfaces in primary HD 140Q/140Q neurons. Primary neurons at DIV8 were used for studies. A) Western blot analysis of biotinylated cell surface proteins and corresponding post-nuclear supernatants of WT and HD cortical neurons. Shown is one blot analysis of three experiments. B) Densitometry. Intensities of signals for biotinylated Glut3 (cell surface) and for total Glut3 in post-nuclear supernatants were measured using NIH ImageJ. The ratio of biotinylated Glut3 to total Glut3 was used for calculating the percentage of WT, which was set as 100%. Mean ± SD percentage of WT was graphed (n = 3 experiments, Student’ t-test: * p < 0.05). C) Western blot shows distribution of Glut3 compared to that of NCAM, a protein known to locate mainly on the neuronal cell surface, and to that of actin, which is predominantly intracellular. Shown is one of 3 sets of analysis of Glut3, NCAM and actin distribution in primary WT cortical neurons. All of the aqueous solution eluted from the Streptavidin beads and 30% of unbiotinylated proteins were used for Western blot analysis.
Figure 2
Figure 2
Glut3 is localized at rab11-positive endosomes. A), Co-localization of Glut3 and rab11 in primary cortical neurons. Primary WT neurons on glass coverslips were processed for immunofluorescence labeling of endogenous Glut3 (red) and endogenous rab11 (green) analyzed by confocal microscopy. Yellow areas in the merged photo show signals positive for both Glut3 and rab11. The boxed region containing part of a neurite in each channel is enlarged and shown at the lower left corner of the corresponding channel. Arrowheads in enlarged photos indicate co-localization of Glut3 and rab11. B), Co-distribution of Glut3 with rab11 in subcellular brain fractions. Density gradient ultracentrifugation was conducted as described in Methods. Equal volume of each fraction was used for Western blot analysis. Shown is one blot analysis of three experiments from three mice. C), Glut3 is present in organelles immuno-isolated from brain lysates using anti-rab11 antibodies. Fraction-5 from (B) was diluted in detergent-free buffer and incubated with antibodies specific for rab11 or FLAG pre-immobilized on protein-A resins. After washes in detergent-free buffer, proteins on protein-A resins were analyzed by Western blot with antibodies against Glut3. Shown is a Western blot analysis from one of three experiments.
Figure 3
Figure 3
Rab11 regulates Glut3 trafficking. A) Defective glucose uptake in immortalized STHdhQ111/Q111 striatal cells. [3H]deoxyglucose uptake was performed in PBS at room temperature for 20 minutes. After uptake, cells were washed three times in cold PBS and cell lysates were prepared. The amount of [3H]deoxyglucose in cell lysates was measured by liquid scintillation. Mean ± SD cpm per minute per milligram protein was calculated and graphed (N = 3, Two tailed Student t-test). B) Western blot analysis of post-nuclear supernatants showed up-regulated Glut3 protein expression in STHdhQ111/Q111 cells relative to STHdhQ7/Q7 cells. C) STHdhQ7/Q7 cells were cultured on glass coverslips, fixed and processed for immunofluorescence labeling of endogenous Glut3 (green), endogenous rab11 (red), and nuclei (blue). The boxed region is enlarged and shown at the lower left corner of the corresponding channel. Arrows in enlarged photos indicate structures containing both Glut3 and rab11. D) Western blot analysis of Glut3 levels upon expression of rab11 mutants. STHdhQ7/Q7 cells in 60-mm dishes were infected with lentivirus expressing dNrab11, or virus expressing dArab11, or uninfected (No virus) for two days. Biotinylated proteins and corresponding total cell lysates were analyzed by Western blot. The results from one of three experiments are shown. E) Densitometry of biotinylated Glut3 and corresponding background signals in each condition using NIH ImageJ. The ratio of biotinylated Glut3 signal from cells infected with virus to biotinylated Glut3 signal from cells with no virus infection was graphed (n = 3 experiments, Mean ± SD, Student t-test: *p < 0.05; **p < 0.01). F) Effects of dArab11 or dNrab11 on cell surface expression of Glut3 in STHdhQ111/Q111 cells. Experimental procedures and data analysis were performed as in D). Shown are blot analysis from one of two experiments.
Figure 4
Figure 4
Normal levels of Glut3 protein in HD 140Q/140Q mouse brain. A) Western blot analysis of cortical and striatal lysates of 9–10 month old WT and HD mice. Shown is a blot analysis from one of 6 WT and one of 6 HD mice. B) Intensities of signals for Glut3 and for GAPDH in each condition were measured using NIH ImageJ and the ratio of Glut3 to GAPDH signals was calculated (n = 6 WT and 6 HD mice, Mean ± SD, two-tailed Student’s t-test).
Figure 5
Figure 5
Defective Glut3 trafficking in the brain of adult HD 140Q/140Q mice. A) Antibody binding to detect cell surface Glut3 and GABAα1 in non-permeabilized brain sections of 9–10 month old WT and HD mice. To ascertain that anti-Glut3 and anti-GABAα1 antibodies labeled only cell surface molecules, we omitted detergents in all buffer solutions used for this assay to preserve the intactness of the plasma membrane. Antibodies bound to cell surface Glut3 and GABAα1 were detected using the immunoperoxidase method. Shown in A are images of Glut3 labeling obtained with a SPOT camera. Three WT and 3 age- and gender- matched HD mice were used for analysis. B) and C) Bar graphs show results of densitometry of Glut3 labeled neurons in brain slices for Glut3 surface expression and neuronal cross-sectional area in the cortex and the striatum of adult WT and HD mice. The data were obtained from digital images of 12 microscopic fields of 6 WT and 6 HD brain sections from 2 WT and 2 HD mice, which were treated under exactly the same conditions. The arbitrary units (A.U.) measured with NIH ImageJ were used for calculating Mean ± SD signal intensity per cell. Statistical significance was determined by two-tailed Student’s t-test using N = 12 microscopic fields. D) Antibody binding to detect cell surface GABAα1 in non-permeabilized brain sections. Brain sections were from the same mice as used for detecting Glut3 expression in A). Shown are images obtained with a SPOT camera. E) and F) Bar graphs show results for cross sectional areas and signal intensities of GABAα1 positive neurons in the cortex A. Digital images were taken from 7 microscopic fields from 4 WT and 4 HD brain sections from 2 WT and 2 HD mice in (E) and for GABAα1 signal intensities in (F). Two sections of each animal were used for analysis. For each section, one or two microscopic fields were selected. Error bars in both E and F represent standard deviations. Two-tailed Student’s t-test was performed to determine the statistical significance using N = 7 microscopic fields.

Similar articles

Cited by

References

    1. Anonymous A novel gene containing a trinucleotide repeat that is expanded and unstable on Huntington's disease chromosomes. The Huntington's Disease Collaborative Research Group. (Translated from eng) Cell. 1993;72(6):971–983. doi: 10.1016/0092-8674(93)90585-E. - DOI - PubMed
    1. Shoulson I, Young AB. Milestones in huntington disease. Mov Disord. 2011;26(6):1127–1133. doi: 10.1002/mds.23685. - DOI - PubMed
    1. Kuhl DE, Phelps ME, Markham CH, Metter EJ, Riege WH, Winter J. Cerebral metabolism and atrophy in Huntington's disease determined by 18FDG and computed tomographic scan. Ann Neurol. 1982;12(5):425–434. doi: 10.1002/ana.410120504. - DOI - PubMed
    1. Hayden MR, Martin WRW, Stoessl AJ, Clark C, Hollenberg S, Adam MJ, Ammann W, Harrop R, Rogers J, Ruth T, Sayre C, Pate BD. Positron emission tomography in the early diagnosis of Huntington's disease. Neurology. 1986;36(7):888–894. doi: 10.1212/WNL.36.7.888. - DOI - PubMed
    1. Young AB, Penney JB, Starosta-Rubinstein S, Markel DS, Berent S, Giordani B, Ehrenkaufer R, Jewett D, Hichwa R. PET scan investigations of Huntington's disease: cerebral metabolic correlates of neurological features and functional decline. Ann Neurol. 1986;20(3):296–303. doi: 10.1002/ana.410200305. - DOI - PubMed

Publication types

MeSH terms

LinkOut - more resources