The catalytic topoisomerase II inhibitor dexrazoxane induces DNA breaks, ATF3 and the DNA damage response in cancer cells
- PMID: 25521189
- PMCID: PMC4403091
- DOI: 10.1111/bph.13046
The catalytic topoisomerase II inhibitor dexrazoxane induces DNA breaks, ATF3 and the DNA damage response in cancer cells
Abstract
Background and purpose: The catalytic topoisomerase II inhibitor dexrazoxane has been associated not only with improved cancer patient survival but also with secondary malignancies and reduced tumour response.
Experimental approach: We investigated the DNA damage response and the role of the activating transcription factor 3 (ATF3) accumulation in tumour cells exposed to dexrazoxane.
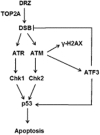
Key results: Dexrazoxane exposure induced topoisomerase IIα (TOP2A)-dependent cell death, γ-H2AX accumulation and increased tail moment in neutral comet assays. Dexrazoxane induced DNA damage responses, shown by enhanced levels of γ-H2AX/53BP1 foci, ATM (ataxia telangiectasia mutated), ATR (ATM and Rad3-related), Chk1 and Chk2 phosphorylation, and by p53 accumulation. Dexrazoxane-induced γ-H2AX accumulation was dependent on ATM. ATF3 protein was induced by dexrazoxane in a concentration- and time-dependent manner, which was abolished in TOP2A-depleted cells and in cells pre-incubated with ATM inhibitor. Knockdown of ATF3 gene expression by siRNA triggered apoptosis in control cells and diminished the p53 protein level in both control and dexrazoxane -treated cells. This was accompanied by increased γ-H2AX accumulation. ATF3 knockdown also delayed the repair of dexrazoxane -induced DNA double-strand breaks.
Conclusions and implications: As with other TOP2A poisons, dexrazoxane induced DNA double-strand breaks followed by activation of the DNA damage response. The DNA damage-triggered ATF3 controlled p53 accumulation and generation of double-strand breaks and is proposed to serve as a switch between DNA damage and cell death following dexrazoxane treatment. These findings suggest a mechanistic explanation for the diverse clinical observations associated with dexrazoxane.
© 2014 The British Pharmacological Society.
Figures


Similar articles
-
Dexrazoxane may prevent doxorubicin-induced DNA damage via depleting both topoisomerase II isoforms.BMC Cancer. 2014 Nov 18;14:842. doi: 10.1186/1471-2407-14-842. BMC Cancer. 2014. PMID: 25406834 Free PMC article.
-
Topoisomerase II{alpha}-dependent and -independent apoptotic effects of dexrazoxane and doxorubicin.Mol Cancer Ther. 2009 May;8(5):1075-85. doi: 10.1158/1535-7163.MCT-09-0139. Epub 2009 May 5. Mol Cancer Ther. 2009. PMID: 19417146
-
NPRL-Z-1, as a new topoisomerase II poison, induces cell apoptosis and ROS generation in human renal carcinoma cells.PLoS One. 2014 Nov 5;9(11):e112220. doi: 10.1371/journal.pone.0112220. eCollection 2014. PLoS One. 2014. PMID: 25372714 Free PMC article.
-
Cytometry of ATM activation and histone H2AX phosphorylation to estimate extent of DNA damage induced by exogenous agents.Cytometry A. 2007 Sep;71(9):648-61. doi: 10.1002/cyto.a.20426. Cytometry A. 2007. PMID: 17622968 Free PMC article. Review.
-
Recent advances in the development of catalytic inhibitors of human DNA topoisomerase IIα as novel anticancer agents.Curr Med Chem. 2013;20(5):694-709. doi: 10.2174/092986713804999402. Curr Med Chem. 2013. PMID: 23210851 Review.
Cited by
-
Cardio-Oncology: A Focused Review of Anthracycline-, Human Epidermal Growth Factor Receptor 2 Inhibitor-, and Radiation-Induced Cardiotoxicity and Management.Ochsner J. 2016 Fall;16(3):250-6. Ochsner J. 2016. PMID: 27660573 Free PMC article. Review.
-
Topoisomerase I inhibition and peripheral nerve injury induce DNA breaks and ATF3-associated axon regeneration in sensory neurons.Cell Rep. 2021 Sep 7;36(10):109666. doi: 10.1016/j.celrep.2021.109666. Cell Rep. 2021. PMID: 34496254 Free PMC article.
-
Activating Transcription Factor 3 as a Novel Regulator of Chemotherapy Response in Breast Cancer.Transl Oncol. 2018 Aug;11(4):988-998. doi: 10.1016/j.tranon.2018.06.001. Epub 2018 Jun 22. Transl Oncol. 2018. PMID: 29940414 Free PMC article.
-
Response by Bernstein to Letter Regarding Article, "Anthracycline Cardiotoxicity: Worrisome Enough to Have You Quaking?".Circ Res. 2018 Mar 30;122(7):e64-e65. doi: 10.1161/CIRCRESAHA.118.312921. Circ Res. 2018. PMID: 29599280 Free PMC article. No abstract available.
-
Acridine Based N-Acylhydrazone Derivatives as Potential Anticancer Agents: Synthesis, Characterization and ctDNA/HSA Spectroscopic Binding Properties.Molecules. 2022 Apr 30;27(9):2883. doi: 10.3390/molecules27092883. Molecules. 2022. PMID: 35566236 Free PMC article.
References
-
- Berdelle N, Nikolova T, Quiros S, Efferth T, Kaina B. Artesunate induces oxidative DNA damage, sustained DNA double-strand breaks, and the ATM/ATR damage response in cancer cells. Mol Cancer Ther. 2011;10:2224–2233. - PubMed
-
- Bonnefoi HR. Anthracyclines, HER2, and TOP2A: the verdict. Lancet Oncol. 2011;12:1084–1085. - PubMed
Publication types
MeSH terms
Substances
LinkOut - more resources
Full Text Sources
Other Literature Sources
Research Materials
Miscellaneous

