

Identifying and validating a combined mRNA and microRNA signature in response to imatinib treatment in a chronic myeloid leukemia cell line
- PMID: 25506832
- PMCID: PMC4266614
- DOI: 10.1371/journal.pone.0115003
Identifying and validating a combined mRNA and microRNA signature in response to imatinib treatment in a chronic myeloid leukemia cell line
Abstract
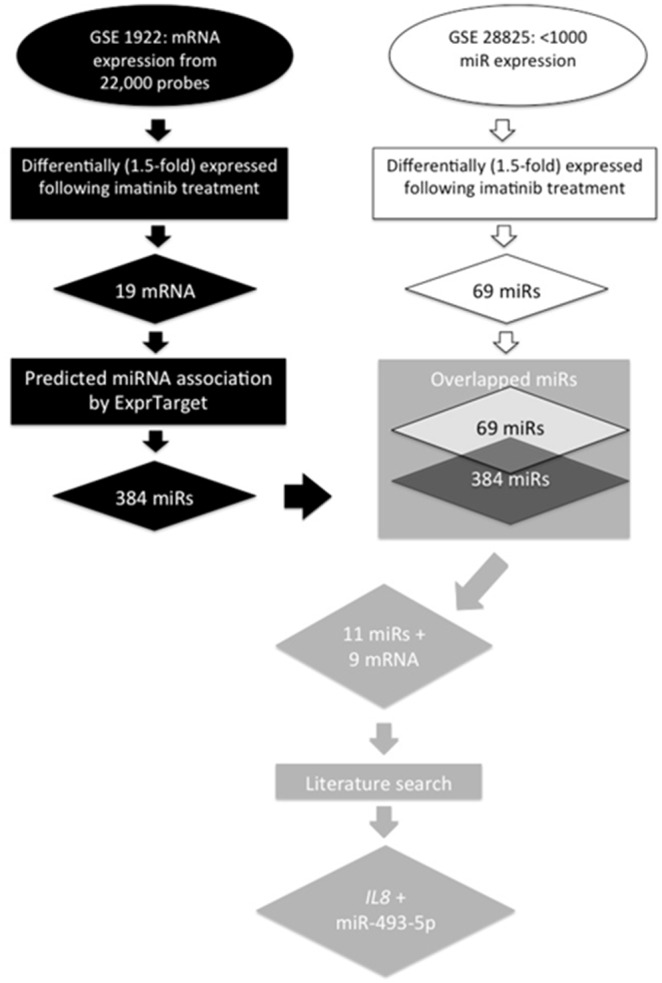
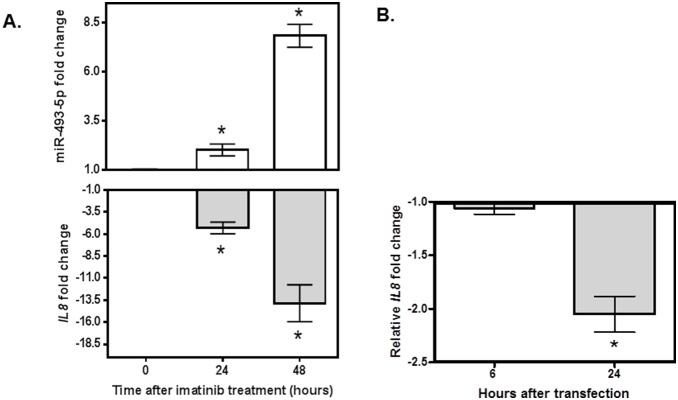
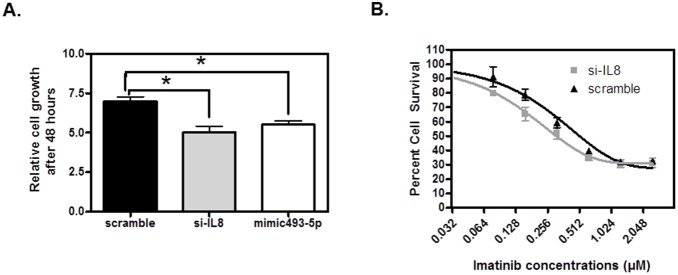
Imatinib, a targeted tyrosine kinase inhibitor, is the gold standard for managing chronic myeloid leukemia (CML). Despite its wide application, imatinib resistance occurs in 20-30% of individuals with CML. Multiple potential biomarkers have been identified to predict imatinib response; however, the majority of them remain externally uncorroborated. In this study, we set out to systematically identify gene/microRNA (miRNA) whose expression changes are related to imatinib response. Through a Gene Expression Omnibus search, we identified two genome-wide expression datasets that contain expression changes in response to imatinib treatment in a CML cell line (K562): one for mRNA and the other for miRNA. Significantly differentially expressed transcripts/miRNAs post imatinib treatment were identified from both datasets. Three additional filtering criteria were applied 1) miRbase/miRanda predictive algorithm; 2) opposite direction of imatinib effect for genes and miRNAs; and 3) literature support. These criteria narrowed our candidate gene-miRNA to a single pair: IL8 and miR-493-5p. Using PCR we confirmed the significant up-regulation and down-regulation of miR-493-5p and IL8 by imatinib treatment, respectively in K562 cells. In addition, IL8 expression was significantly down-regulated in K562 cells 24 hours after miR-493-5p mimic transfection (p = 0.002). Furthermore, we demonstrated significant cellular growth inhibition after IL8 inhibition through either gene silencing or by over-expression of miR-493-5p (p = 0.0005 and p = 0.001 respectively). The IL8 inhibition also further sensitized K562 cells to imatinib cytotoxicity (p < 0.0001). Our study combined expression changes in transcriptome and miRNA after imatinib exposure to identify a potential gene-miRNA pair that is a critical target in imatinib response. Experimental validation supports the relationships between IL8 and miR-493-5p and between this gene-miRNA pair and imatinib sensitivity in a CML cell line. Our data suggests integrative analysis of multiple omic level data may provide new insight into biomarker discovery as well as mechanisms of imatinib resistance.
Conflict of interest statement
Figures
Similar articles
-
Revealing genome-wide mRNA and microRNA expression patterns in leukemic cells highlighted "hsa-miR-2278" as a tumor suppressor for regain of chemotherapeutic imatinib response due to targeting STAT5A.Tumour Biol. 2015 Sep;36(10):7915-27. doi: 10.1007/s13277-015-3509-9. Epub 2015 May 8. Tumour Biol. 2015. PMID: 25953263
-
Overexpression of miR-202 resensitizes imatinib resistant chronic myeloid leukemia cells through targetting Hexokinase 2.Biosci Rep. 2018 May 8;38(3):BSR20171383. doi: 10.1042/BSR20171383. Print 2018 Jun 29. Biosci Rep. 2018. PMID: 29559564 Free PMC article.
-
AKR1C3 decreased CML sensitivity to Imatinib in bone marrow microenvironment via dysregulation of miR-379-5p.Cell Signal. 2021 Aug;84:110038. doi: 10.1016/j.cellsig.2021.110038. Epub 2021 May 11. Cell Signal. 2021. PMID: 33984486
-
[MET/ERK and MET/JNK Pathway Activation Is Involved in BCR-ABL Inhibitor-resistance in Chronic Myeloid Leukemia].Yakugaku Zasshi. 2018;138(12):1461-1466. doi: 10.1248/yakushi.18-00142. Yakugaku Zasshi. 2018. PMID: 30504658 Review. Japanese.
-
The role of microRNAs in the development, progression and drug resistance of chronic myeloid leukemia and their potential clinical significance.Life Sci. 2022 May 1;296:120437. doi: 10.1016/j.lfs.2022.120437. Epub 2022 Feb 26. Life Sci. 2022. PMID: 35231484 Review.
Cited by
-
Microarray profile of circular RNAs identifies hsa_circ_0014130 as a new circular RNA biomarker in non-small cell lung cancer.Sci Rep. 2018 Feb 13;8(1):2878. doi: 10.1038/s41598-018-21300-5. Sci Rep. 2018. PMID: 29440731 Free PMC article.
-
Revealing genome-wide mRNA and microRNA expression patterns in leukemic cells highlighted "hsa-miR-2278" as a tumor suppressor for regain of chemotherapeutic imatinib response due to targeting STAT5A.Tumour Biol. 2015 Sep;36(10):7915-27. doi: 10.1007/s13277-015-3509-9. Epub 2015 May 8. Tumour Biol. 2015. PMID: 25953263
-
Tumor-suppressive MEG3 induces microRNA-493-5p expression to reduce arabinocytosine chemoresistance of acute myeloid leukemia cells by downregulating the METTL3/MYC axis.J Transl Med. 2022 Jun 27;20(1):288. doi: 10.1186/s12967-022-03456-x. J Transl Med. 2022. PMID: 35761379 Free PMC article.
-
Can the chemotherapeutic agents perform anticancer activity through miRNA expression regulation? Proposing a new hypothesis [corrected].Protoplasma. 2015 Nov;252(6):1603-10. doi: 10.1007/s00709-015-0776-7. Epub 2015 Feb 20. Protoplasma. 2015. PMID: 25698235
-
microRNA-21 Expression as Prognostic and Therapeutic Response Marker in Chronic Myeloid Leukaemia Patients.Asian Pac J Cancer Prev. 2019 Aug 1;20(8):2379-2383. doi: 10.31557/APJCP.2019.20.8.2379. Asian Pac J Cancer Prev. 2019. PMID: 31450909 Free PMC article.
References
-
- Mauro MJ, Druker BJ (2001) STI571: a gene product-targeted therapy for leukemia. Curr Oncol Rep 3:223–227. - PubMed
Publication types
MeSH terms
Substances
Grants and funding
- UL1 TR000430/TR/NCATS NIH HHS/United States
- U01 GM061393/GM/NIGMS NIH HHS/United States
- P50 CA125183/CA/NCI NIH HHS/United States
- R25 HL096383/HL/NHLBI NIH HHS/United States
- K08 GM089941/GM/NIGMS NIH HHS/United States
- R21 CA139278/CA/NCI NIH HHS/United States
- K08GM089941/GM/NIGMS NIH HHS/United States
- 5R25HL096383-05/HL/NHLBI NIH HHS/United States
- UL1RR024999/RR/NCRR NIH HHS/United States
- UL1 RR024999/RR/NCRR NIH HHS/United States
- P30 CA14599/CA/NCI NIH HHS/United States
- CA125183/CA/NCI NIH HHS/United States
- P30 CA014599/CA/NCI NIH HHS/United States
- U01GM61393/GM/NIGMS NIH HHS/United States
LinkOut - more resources
Full Text Sources
Other Literature Sources
Medical
