

Genetically encoded molecular biosensors to image histone methylation in living animals
- PMID: 25506787
- PMCID: PMC4303335
- DOI: 10.1021/ac502629r
Genetically encoded molecular biosensors to image histone methylation in living animals
Abstract
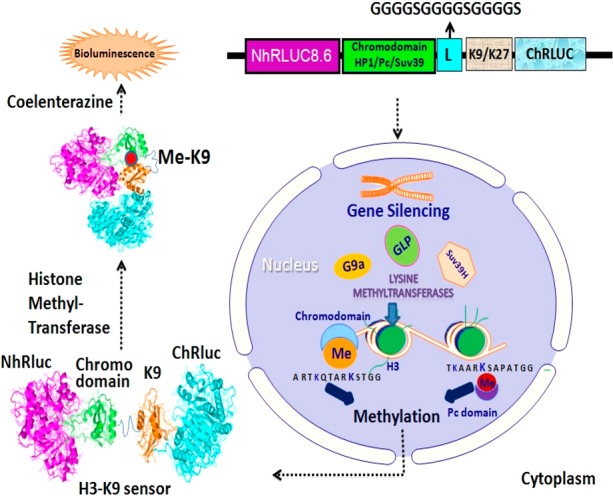
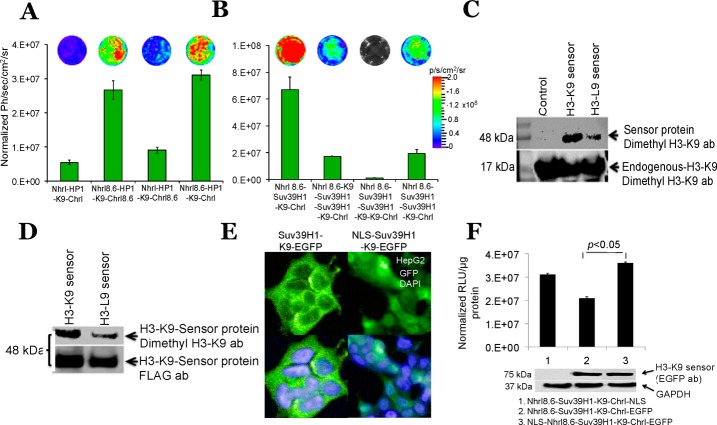
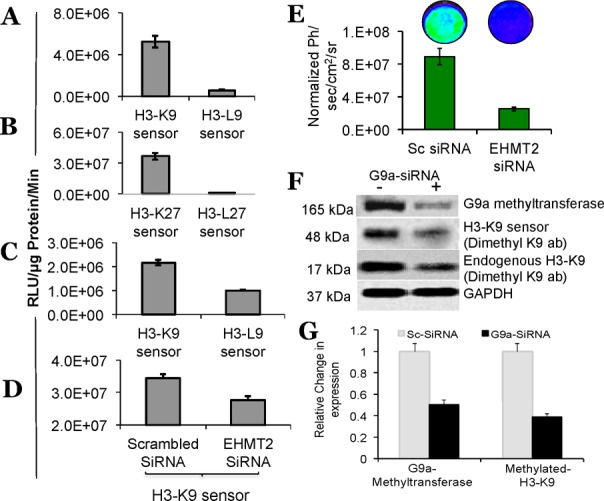
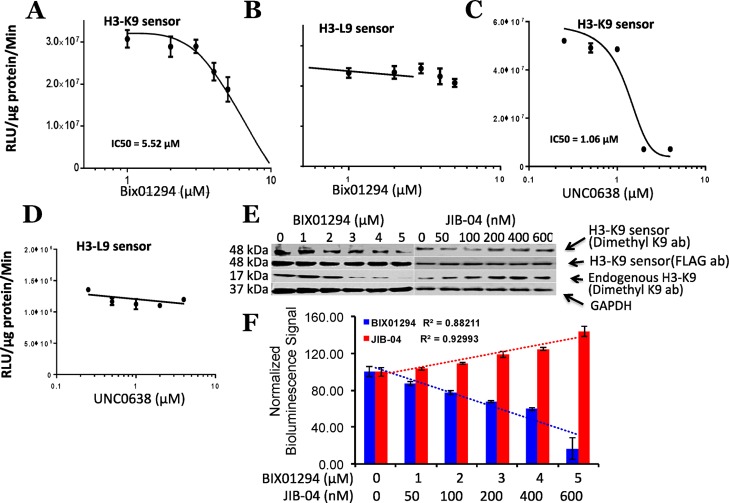
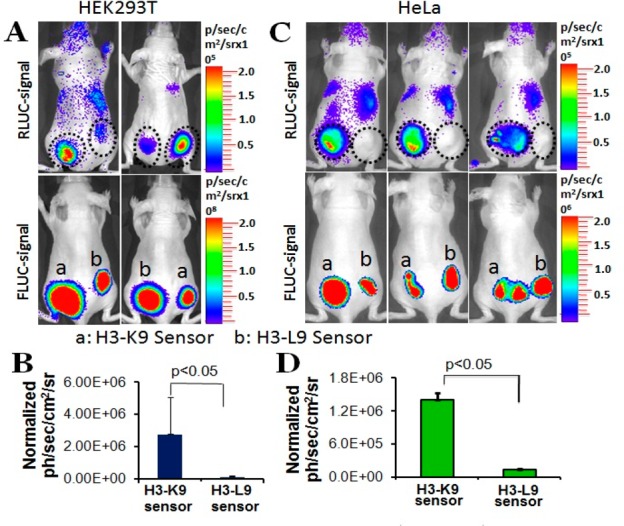
Post-translational addition of methyl groups to the amino terminal tails of histone proteins regulates cellular gene expression at various stages of development and the pathogenesis of cellular diseases, including cancer. Several enzymes that modulate these post-translational modifications of histones are promising targets for development of small molecule drugs. However, there is no promising real-time histone methylation detection tool currently available to screen and validate potential small molecule histone methylation modulators in small animal models. With this in mind, we developed genetically encoded molecular biosensors based on the split-enzyme complementation approach for in vitro and in vivo imaging of lysine 9 (H3-K9 sensor) and lysine 27 (H3-K27 sensor) methylation marks of histone 3. These methylation sensors were validated in vitro in HEK293T, HepG2, and HeLa cells. The efficiency of the histone methylation sensor was assessed by employing methyltransferase inhibitors (Bix01294 and UNC0638), demethylase inhibitor (JIB-04), and siRNA silencing at the endogenous histone K9-methyltransferase enzyme level. Furthermore, noninvasive bioluminescence imaging of histone methylation sensors confirmed the potential of these sensors in monitoring histone methylation status in response to histone methyltransferase inhibitors in living animals. Experimental results confirmed that the developed H3-K9 and H3-K27 sensors are specific and sensitive to image the drug-induced histone methylation changes in living animals. These novel histone methylation sensors can facilitate the in vitro screening and in vivo characterization of new histone methyltransferase inhibitors and accelerate the pace of introduction of epigenetic therapies into the clinic.
Figures
Similar articles
-
Degron protease blockade sensor to image epigenetic histone protein methylation in cells and living animals.ACS Chem Biol. 2015 Jan 16;10(1):165-74. doi: 10.1021/cb5008037. Epub 2014 Dec 30. ACS Chem Biol. 2015. PMID: 25489787 Free PMC article.
-
Purification and functional characterization of a histone H3-lysine 4-specific methyltransferase.Mol Cell. 2001 Dec;8(6):1207-17. doi: 10.1016/s1097-2765(01)00405-1. Mol Cell. 2001. PMID: 11779497
-
Cross-talk between histone modifications in response to histone deacetylase inhibitors: MLL4 links histone H3 acetylation and histone H3K4 methylation.J Biol Chem. 2007 Feb 16;282(7):4408-4416. doi: 10.1074/jbc.M606773200. Epub 2006 Dec 13. J Biol Chem. 2007. PMID: 17166833
-
[The roles of histone lysine methylation in epigenetic regulation].Yi Chuan. 2007 Apr;29(4):387-92. doi: 10.1360/yc-007-0387. Yi Chuan. 2007. PMID: 17548299 Review. Chinese.
-
Targeting Histone Methylation in Cancer.Cancer J. 2017 Sep/Oct;23(5):292-301. doi: 10.1097/PPO.0000000000000283. Cancer J. 2017. PMID: 28926430 Review.
Cited by
-
Imaging Translational and Post-Translational Gene Regulatory Dynamics in Living Cells with Antibody-Based Probes.Trends Genet. 2017 May;33(5):322-335. doi: 10.1016/j.tig.2017.02.003. Epub 2017 Mar 27. Trends Genet. 2017. PMID: 28359585 Free PMC article. Review.
-
Coordinated histone modifications and chromatin reorganization in a single cell revealed by FRET biosensors.Proc Natl Acad Sci U S A. 2018 Dec 11;115(50):E11681-E11690. doi: 10.1073/pnas.1811818115. Epub 2018 Nov 26. Proc Natl Acad Sci U S A. 2018. PMID: 30478057 Free PMC article.
-
The ABCs of PTMs.Nat Chem Biol. 2018 Feb 14;14(3):188-192. doi: 10.1038/nchembio.2572. Nat Chem Biol. 2018. PMID: 29443972 Free PMC article.
-
Intrabody-based FRET probe to visualize endogenous histone acetylation.Sci Rep. 2019 Jul 15;9(1):10188. doi: 10.1038/s41598-019-46573-2. Sci Rep. 2019. PMID: 31308423 Free PMC article.
-
Modified Histone Peptides Linked to Magnetic Beads Reduce Binding Specificity.Int J Mol Sci. 2022 Feb 1;23(3):1691. doi: 10.3390/ijms23031691. Int J Mol Sci. 2022. PMID: 35163614 Free PMC article.
References
-
- Herceg Z.; Vaissiere T. Epigenetics 2011, 6, 804–819. - PubMed
Publication types
MeSH terms
Substances
Grants and funding
LinkOut - more resources
Full Text Sources
Other Literature Sources
