CCR2-dependent dendritic cell accumulation in the central nervous system during early effector experimental autoimmune encephalomyelitis is essential for effector T cell restimulation in situ and disease progression
- PMID: 25505278
- PMCID: PMC4362728
- DOI: 10.4049/jimmunol.1401320
CCR2-dependent dendritic cell accumulation in the central nervous system during early effector experimental autoimmune encephalomyelitis is essential for effector T cell restimulation in situ and disease progression
Abstract
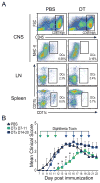
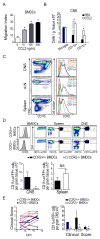
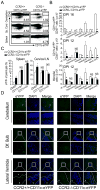
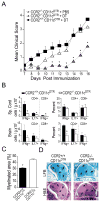
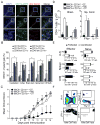
Dendritic cells (DCs)--although absent from the healthy CNS parenchyma--rapidly accumulate within brain and spinal cord tissue during neuroinflammation associated with experimental autoimmune encephalomyelitis (EAE; a mouse model of multiple sclerosis). Yet, although DCs have been appreciated for their role in initiating adaptive immune responses in peripheral lymphoid organ tissues, how DCs infiltrate the CNS and contribute to ongoing neuroinflammation in situ is poorly understood. In this study, we report the following: 1) CD11c(+) bone marrow-derived DCs and CNS-infiltrating DCs express chemokine receptor CCR2; 2) compared with CCR2(+/+) cells, adoptively transferred CCR2(-/-) bone marrow-derived DCs or DC precursors do not accumulate in the CNS during EAE, despite abundance in blood; 3) CCR2(-/-) DCs show less accumulation in the inflamed CNS in mixed bone marrow chimeras, when compared with CCR2(+/+) DCs; and 4) ablation of CCR2(+/+) DCs during EAE clinical onset delays progression and attenuates cytokine production by infiltrating T cells. Whereas the role of CCR2 in monocyte migration into the CNS has been implicated previously, the role of CCR2 in DC infiltration into the CNS has never been directly addressed. Our data suggest that CCR2-dependent DC recruitment to the CNS during ongoing neuroinflammation plays a crucial role in effector T cell cytokine production and disease progression, and signify that CNS-DCs and circulating DC precursors might be key therapeutic targets for suppressing ongoing neuroinflammation in CNS autoimmune diseases.
Copyright © 2015 by The American Association of Immunologists, Inc.
Figures

Similar articles
-
NG2, a common denominator for neuroinflammation, blood-brain barrier alteration, and oligodendrocyte precursor response in EAE, plays a role in dendritic cell activation.Acta Neuropathol. 2016 Jul;132(1):23-42. doi: 10.1007/s00401-016-1563-z. Epub 2016 Mar 30. Acta Neuropathol. 2016. PMID: 27026411 Free PMC article.
-
CNS-resident classical DCs play a critical role in CNS autoimmune disease.J Clin Invest. 2018 Dec 3;128(12):5322-5334. doi: 10.1172/JCI123708. Epub 2018 Oct 29. J Clin Invest. 2018. PMID: 30226829 Free PMC article.
-
CCR6 regulates EAE pathogenesis by controlling regulatory CD4+ T-cell recruitment to target tissues.Eur J Immunol. 2009 Jun;39(6):1671-81. doi: 10.1002/eji.200839123. Eur J Immunol. 2009. PMID: 19499521
-
The role of dendritic cells in CNS autoimmunity.J Mol Med (Berl). 2010 Jun;88(6):535-44. doi: 10.1007/s00109-010-0607-4. Epub 2010 Mar 9. J Mol Med (Berl). 2010. PMID: 20217033 Free PMC article. Review.
-
The role of MCP-1 (CCL2) and CCR2 in multiple sclerosis and experimental autoimmune encephalomyelitis (EAE).Semin Immunol. 2003 Feb;15(1):23-32. doi: 10.1016/s1044-5323(02)00125-2. Semin Immunol. 2003. PMID: 12495638 Review.
Cited by
-
A Novel In Vitro Mouse Model to Study Mycobacterium tuberculosis Dissemination Across Brain Vessels: A Combination Granuloma and Blood-Brain Barrier Mouse Model.Curr Protoc Immunol. 2020 Sep;130(1):e101. doi: 10.1002/cpim.101. Curr Protoc Immunol. 2020. PMID: 32716613 Free PMC article.
-
Conditional Silencing of H-2Db Class I Molecule Expression Modulates the Protective and Pathogenic Kinetics of Virus-Antigen-Specific CD8 T Cell Responses during Theiler's Virus Infection.J Immunol. 2020 Sep 1;205(5):1228-1238. doi: 10.4049/jimmunol.2000340. Epub 2020 Jul 31. J Immunol. 2020. PMID: 32737149 Free PMC article.
-
Self-reactive CD4+ IL-3+ T cells amplify autoimmune inflammation in myocarditis by inciting monocyte chemotaxis.J Exp Med. 2019 Feb 4;216(2):369-383. doi: 10.1084/jem.20180722. Epub 2019 Jan 22. J Exp Med. 2019. PMID: 30670465 Free PMC article.
-
CCR2 Signaling Promotes Brain Infiltration of Inflammatory Monocytes and Contributes to Neuropathology during Cryptococcal Meningoencephalitis.mBio. 2021 Aug 31;12(4):e0107621. doi: 10.1128/mBio.01076-21. Epub 2021 Jul 27. mBio. 2021. PMID: 34311579 Free PMC article.
-
A silent agonist of α7 nicotinic acetylcholine receptors modulates inflammation ex vivo and attenuates EAE.Brain Behav Immun. 2020 Jul;87:286-300. doi: 10.1016/j.bbi.2019.12.014. Epub 2019 Dec 23. Brain Behav Immun. 2020. PMID: 31874200 Free PMC article.
References
-
- Juedes AE, Ruddle NH. Resident and infiltrating central nervous system APCs regulate the emergence and resolution of experimental autoimmune encephalomyelitis. J Immunol. 2001;166:5168–5175. - PubMed
-
- McMahon EJ, Bailey SL, Castenada CV, Waldner H, Miller SD. Epitope spreading initiates in the CNS in two mouse models of multiple sclerosis. Nature medicine. 2005;11:335–339. - PubMed
-
- Greter M, Heppner FL, Lemos MP, Odermatt BM, Goebels N, Laufer T, Noelle RJ, Becher B. Dendritic cells permit immune invasion of the CNS in an animal model of multiple sclerosis. Nature medicine. 2005;11:328–334. - PubMed
-
- Bulloch K, Miller MM, Gal-Toth J, Milner TA, Gottfried-Blackmore A, Waters EM, Kaunzner UW, Liu K, Lindquist R, Nussenzweig MC, Steinman RM, McEwen BS. CD11c/EYFP transgene illuminates a discrete network of dendritic cells within the embryonic, neonatal, adult, and injured mouse brain. The Journal of comparative neurology. 2008;508:687–710. - PubMed
-
- Gottfried-Blackmore A, Kaunzner UW, Idoyaga J, Felger JC, McEwen BS, Bulloch K. Acute in vivo exposure to interferon-gamma enables resident brain dendritic cells to become effective antigen presenting cells. Proceedings of the National Academy of Sciences of the United States of America. 2009;106:20918–20923. - PMC - PubMed
Publication types
MeSH terms
Substances
Grants and funding
LinkOut - more resources
Full Text Sources
Other Literature Sources
Molecular Biology Databases
Research Materials

