The molecular signature of the stroma response in prostate cancer-induced osteoblastic bone metastasis highlights expansion of hematopoietic and prostate epithelial stem cell niches
- PMID: 25485970
- PMCID: PMC4259356
- DOI: 10.1371/journal.pone.0114530
The molecular signature of the stroma response in prostate cancer-induced osteoblastic bone metastasis highlights expansion of hematopoietic and prostate epithelial stem cell niches
Abstract
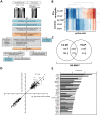
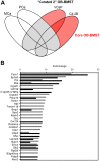
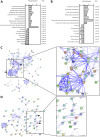
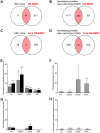
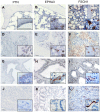
The reciprocal interaction between cancer cells and the tissue-specific stroma is critical for primary and metastatic tumor growth progression. Prostate cancer cells colonize preferentially bone (osteotropism), where they alter the physiological balance between osteoblast-mediated bone formation and osteoclast-mediated bone resorption, and elicit prevalently an osteoblastic response (osteoinduction). The molecular cues provided by osteoblasts for the survival and growth of bone metastatic prostate cancer cells are largely unknown. We exploited the sufficient divergence between human and mouse RNA sequences together with redefinition of highly species-specific gene arrays by computer-aided and experimental exclusion of cross-hybridizing oligonucleotide probes. This strategy allowed the dissection of the stroma (mouse) from the cancer cell (human) transcriptome in bone metastasis xenograft models of human osteoinductive prostate cancer cells (VCaP and C4-2B). As a result, we generated the osteoblastic bone metastasis-associated stroma transcriptome (OB-BMST). Subtraction of genes shared by inflammation, wound healing and desmoplastic responses, and by the tissue type-independent stroma responses to a variety of non-osteotropic and osteotropic primary cancers generated a curated gene signature ("Core" OB-BMST) putatively representing the bone marrow/bone-specific stroma response to prostate cancer-induced, osteoblastic bone metastasis. The expression pattern of three representative Core OB-BMST genes (PTN, EPHA3 and FSCN1) seems to confirm the bone specificity of this response. A robust induction of genes involved in osteogenesis and angiogenesis dominates both the OB-BMST and Core OB-BMST. This translates in an amplification of hematopoietic and, remarkably, prostate epithelial stem cell niche components that may function as a self-reinforcing bone metastatic niche providing a growth support specific for osteoinductive prostate cancer cells. The induction of this combinatorial stem cell niche is a novel mechanism that may also explain cancer cell osteotropism and local interference with hematopoiesis (myelophthisis). Accordingly, these stem cell niche components may represent innovative therapeutic targets and/or serum biomarkers in osteoblastic bone metastasis.
Conflict of interest statement
Figures
Similar articles
-
Prostate cancer cells-osteoblast interaction shifts expression of growth/survival-related genes in prostate cancer and reduces expression of osteoprotegerin in osteoblasts.Clin Cancer Res. 2003 Jul;9(7):2587-97. Clin Cancer Res. 2003. PMID: 12855635
-
Discoidin domain receptor 2 facilitates prostate cancer bone metastasis via regulating parathyroid hormone-related protein.Biochim Biophys Acta. 2014 Sep;1842(9):1350-63. doi: 10.1016/j.bbadis.2014.04.018. Epub 2014 Apr 27. Biochim Biophys Acta. 2014. PMID: 24787381
-
TMPRSS2:ERG gene fusion expression regulates bone markers and enhances the osteoblastic phenotype of prostate cancer bone metastases.Cancer Lett. 2018 Dec 1;438:32-43. doi: 10.1016/j.canlet.2018.08.027. Epub 2018 Sep 7. Cancer Lett. 2018. PMID: 30201302
-
The role of tumor microenvironment in prostate cancer bone metastasis.J Cell Biochem. 2007 Jul 1;101(4):873-86. doi: 10.1002/jcb.21214. J Cell Biochem. 2007. PMID: 17387734 Review.
-
[Mechanism of osteoblastic bone metastasis of prostate cancer].Clin Calcium. 2006 Apr;16(4):557- 64. Clin Calcium. 2006. PMID: 16582505 Review. Japanese.
Cited by
-
Advancing Treatment of Bone Metastases through Novel Translational Approaches Targeting the Bone Microenvironment.Cancers (Basel). 2022 Feb 1;14(3):757. doi: 10.3390/cancers14030757. Cancers (Basel). 2022. PMID: 35159026 Free PMC article. Review.
-
Role of prostate and bone stromal cells on prostate cancer progression.Am J Clin Exp Urol. 2022 Jun 15;10(3):180-187. eCollection 2022. Am J Clin Exp Urol. 2022. PMID: 35874291 Free PMC article. Review.
-
Prediction of Biochemical Recurrence Based on Molecular Detection of Lymph Node Metastasis After Radical Prostatectomy.Eur Urol Open Sci. 2022 Aug 16;44:1-10. doi: 10.1016/j.euros.2022.07.005. eCollection 2022 Oct. Eur Urol Open Sci. 2022. PMID: 36185585 Free PMC article.
-
Establishment of cancer-associated fibroblasts-related subtypes and prognostic index for prostate cancer through single-cell and bulk RNA transcriptome.Sci Rep. 2023 Jun 3;13(1):9016. doi: 10.1038/s41598-023-36125-0. Sci Rep. 2023. PMID: 37270661 Free PMC article.
-
Matricellular proteins as regulators of cancer metastasis to bone.Matrix Biol. 2016 May-Jul;52-54:301-314. doi: 10.1016/j.matbio.2016.01.006. Epub 2016 Jan 22. Matrix Biol. 2016. PMID: 26807761 Free PMC article. Review.
References
-
- Weckermann D, Muller P, Wawroschek F, Harzmann R, Riethmüller G, et al. (2001) Disseminated cytokeratin positive tumor cells in the bone marrow of patients with prostate cancer: detection and prognostic value. J Urol 166:699–703. - PubMed
-
- Bubendorf L, Schopfer A, Wagner U, Sauter G, Moch H, et al. (2000) Metastatic patterns of prostate cancer: an autopsy study of 1,589 patients. Hum Pathol 31:578–583. - PubMed
Publication types
MeSH terms
Substances
Grants and funding
LinkOut - more resources
Full Text Sources
Other Literature Sources
Medical
Research Materials
Miscellaneous

