Comparative evaluation of gene set analysis approaches for RNA-Seq data
- PMID: 25475910
- PMCID: PMC4265362
- DOI: 10.1186/s12859-014-0397-8
Comparative evaluation of gene set analysis approaches for RNA-Seq data
Abstract
Background: Over the last few years transcriptome sequencing (RNA-Seq) has almost completely taken over microarrays for high-throughput studies of gene expression. Currently, the most popular use of RNA-Seq is to identify genes which are differentially expressed between two or more conditions. Despite the importance of Gene Set Analysis (GSA) in the interpretation of the results from RNA-Seq experiments, the limitations of GSA methods developed for microarrays in the context of RNA-Seq data are not well understood.
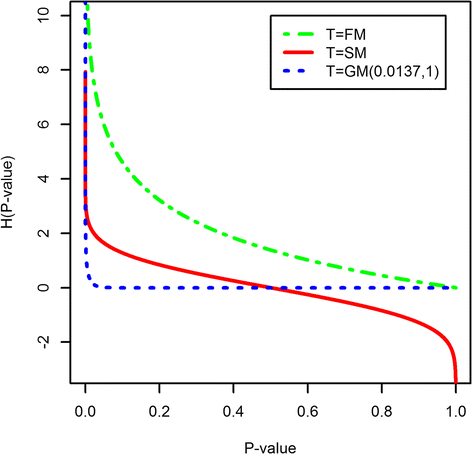
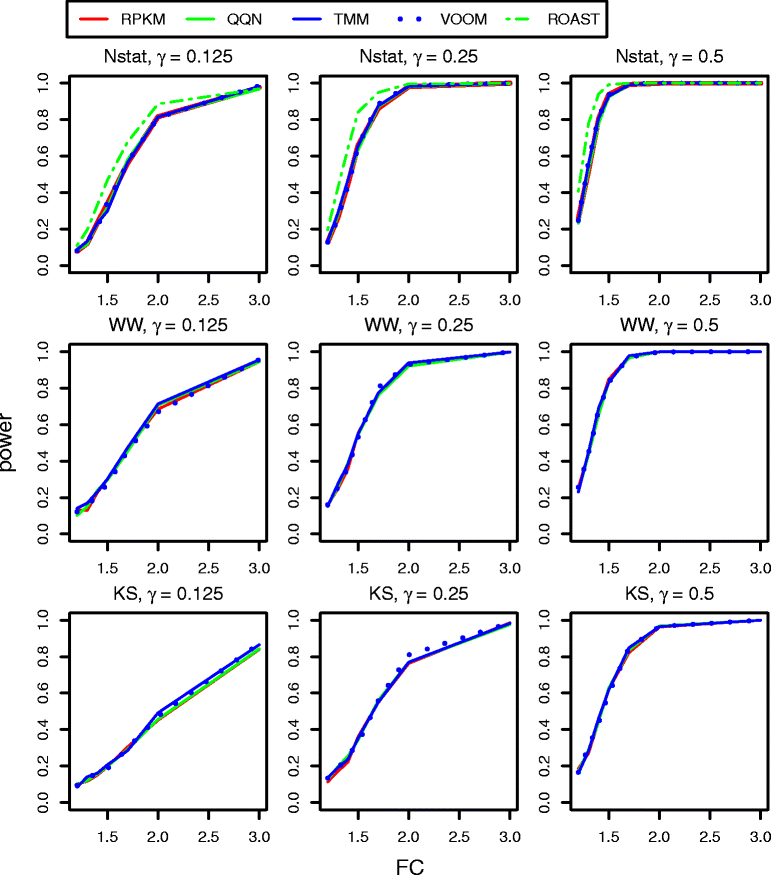
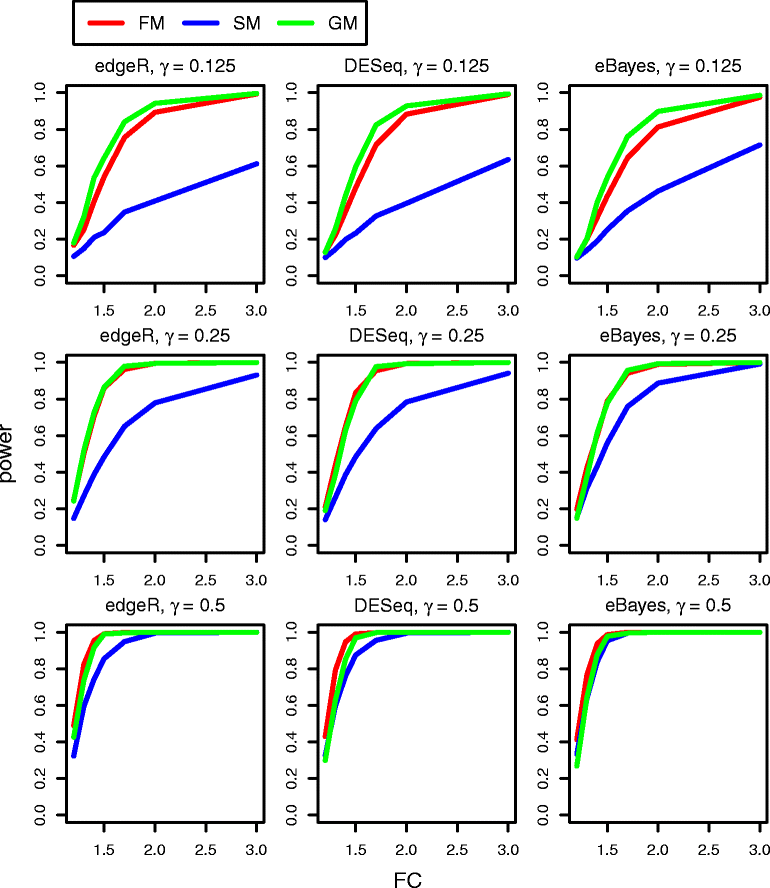
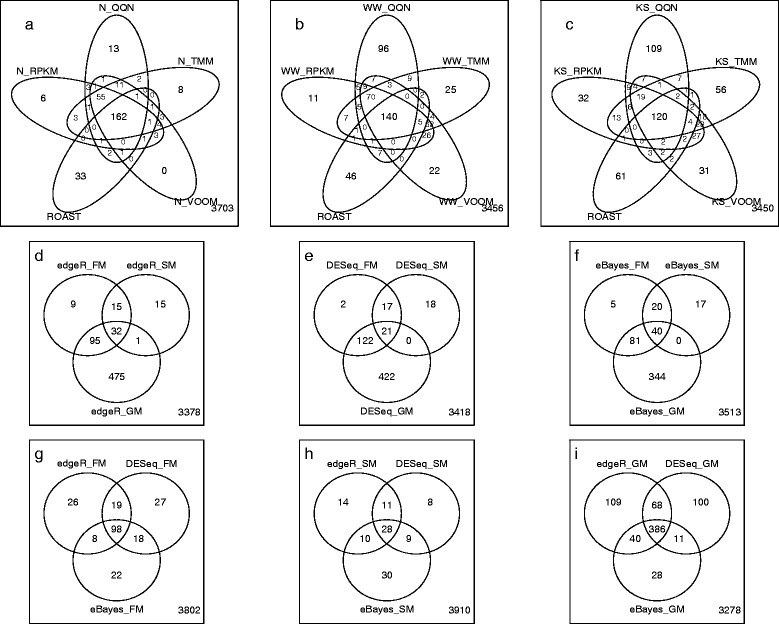
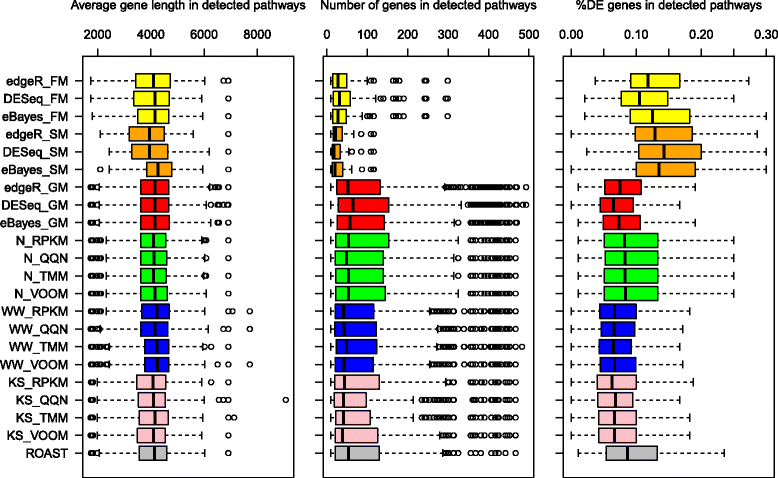
Results: We provide a thorough evaluation of popular multivariate and gene-level self-contained GSA approaches on simulated and real RNA-Seq data. The multivariate approach employs multivariate non-parametric tests combined with popular normalizations for RNA-Seq data. The gene-level approach utilizes univariate tests designed for the analysis of RNA-Seq data to find gene-specific P-values and combines them into a pathway P-value using classical statistical techniques. Our results demonstrate that the Type I error rate and the power of multivariate tests depend only on the test statistics and are insensitive to the different normalizations. In general standard multivariate GSA tests detect pathways that do not have any bias in terms of pathways size, percentage of differentially expressed genes, or average gene length in a pathway. In contrast the Type I error rate and the power of gene-level GSA tests are heavily affected by the methods for combining P-values, and all aforementioned biases are present in detected pathways.
Conclusions: Our result emphasizes the importance of using self-contained non-parametric multivariate tests for detecting differentially expressed pathways for RNA-Seq data and warns against applying gene-level GSA tests, especially because of their high level of Type I error rates for both, simulated and real data.
Figures
Similar articles
-
Gene set analysis approaches for RNA-seq data: performance evaluation and application guideline.Brief Bioinform. 2016 May;17(3):393-407. doi: 10.1093/bib/bbv069. Epub 2015 Sep 4. Brief Bioinform. 2016. PMID: 26342128 Free PMC article.
-
SPARTA: Simple Program for Automated reference-based bacterial RNA-seq Transcriptome Analysis.BMC Bioinformatics. 2016 Feb 4;17:66. doi: 10.1186/s12859-016-0923-y. BMC Bioinformatics. 2016. PMID: 26847232 Free PMC article.
-
Synthetic data sets for the identification of key ingredients for RNA-seq differential analysis.Brief Bioinform. 2018 Jan 1;19(1):65-76. doi: 10.1093/bib/bbw092. Brief Bioinform. 2018. PMID: 27742662
-
Statistical detection of differentially expressed genes based on RNA-seq: from biological to phylogenetic replicates.Brief Bioinform. 2016 Mar;17(2):243-8. doi: 10.1093/bib/bbv035. Epub 2015 Jun 24. Brief Bioinform. 2016. PMID: 26108230 Review.
-
RNA-Seq methods for transcriptome analysis.Wiley Interdiscip Rev RNA. 2017 Jan;8(1):10.1002/wrna.1364. doi: 10.1002/wrna.1364. Epub 2016 May 19. Wiley Interdiscip Rev RNA. 2017. PMID: 27198714 Free PMC article. Review.
Cited by
-
Probabilistic prioritization of candidate pathway association with pathway score.BMC Bioinformatics. 2018 Oct 24;19(1):391. doi: 10.1186/s12859-018-2411-z. BMC Bioinformatics. 2018. PMID: 30355338 Free PMC article.
-
Data- and knowledge-based modeling of gene regulatory networks: an update.EXCLI J. 2015 Mar 2;14:346-78. doi: 10.17179/excli2015-168. eCollection 2015. EXCLI J. 2015. PMID: 27047314 Free PMC article. Review.
-
Simultaneous Enrichment Analysis of all Possible Gene-sets: Unifying Self-Contained and Competitive Methods.Brief Bioinform. 2020 Jul 15;21(4):1302-1312. doi: 10.1093/bib/bbz074. Brief Bioinform. 2020. PMID: 31297505 Free PMC article. Review.
-
Proteome-transcriptome alignment of molecular portraits achieved by self-contained gene set analysis: Consensus colon cancer subtypes case study.PLoS One. 2019 Aug 22;14(8):e0221444. doi: 10.1371/journal.pone.0221444. eCollection 2019. PLoS One. 2019. PMID: 31437237 Free PMC article.
-
Extracting the Strongest Signals from Omics Data: Differentially Expressed Pathways and Beyond.Methods Mol Biol. 2017;1613:125-159. doi: 10.1007/978-1-4939-7027-8_7. Methods Mol Biol. 2017. PMID: 28849561 Free PMC article.
References
Publication types
MeSH terms
Substances
Grants and funding
LinkOut - more resources
Full Text Sources
Other Literature Sources

