. 2015 Feb 26;518(7540):547-51.
doi: 10.1038/nature13989. Epub 2014 Dec 3.

Tissue-resident macrophages originate from yolk-sac-derived erythro-myeloid progenitors

Affiliations

Tissue-resident macrophages originate from yolk-sac-derived erythro-myeloid progenitors

Elisa Gomez Perdiguero et al. Nature. .

Abstract

Most haematopoietic cells renew from adult haematopoietic stem cells (HSCs), however, macrophages in adult tissues can self-maintain independently of HSCs. Progenitors with macrophage potential in vitro have been described in the yolk sac before emergence of HSCs, and fetal macrophages can develop independently of Myb, a transcription factor required for HSC, and can persist in adult tissues. Nevertheless, the origin of adult macrophages and the qualitative and quantitative contributions of HSC and putative non-HSC-derived progenitors are still unclear. Here we show in mice that the vast majority of adult tissue-resident macrophages in liver (Kupffer cells), brain (microglia), epidermis (Langerhans cells) and lung (alveolar macrophages) originate from a Tie2(+) (also known as Tek) cellular pathway generating Csf1r(+) erythro-myeloid progenitors (EMPs) distinct from HSCs. EMPs develop in the yolk sac at embryonic day (E) 8.5, migrate and colonize the nascent fetal liver before E10.5, and give rise to fetal erythrocytes, macrophages, granulocytes and monocytes until at least E16.5. Subsequently, HSC-derived cells replace erythrocytes, granulocytes and monocytes. Kupffer cells, microglia and Langerhans cells are only marginally replaced in one-year-old mice, whereas alveolar macrophages may be progressively replaced in ageing mice. Our fate-mapping experiments identify, in the fetal liver, a sequence of yolk sac EMP-derived and HSC-derived haematopoiesis, and identify yolk sac EMPs as a common origin for tissue macrophages.


Conflict of interest statement

The authors declare no competing financial interests.

Figures
Extended Data Figure 1
Extended Data Figure 1. Analysis of Csf1r reporter expression in fetal progenitor cells in Csf1riCre Rosa26YFP.
a, Schematic representation of the different hematopoietic and non-hematopoietic sites dissected in the mouse embryos: yolk sac (YS), aorta-gonado-mesonephros (AGM) region, fetal liver and head. b, Experimental design for fate mapping analysis of Csf1r-expressing cells. Arrows indicate analysed time points c, Kit and CD45 expression on YFP+ cells from Csf1riCre Rosa26YFP embryos (E8.25, n=7; E8.5, n=4; E9.25-E9.5, n=16; E10.25, n=9; E10.5, n=5; E11.5, n=8; E12.5, n=5) d Number of YFP+ Kit+ CD45low cells per organ/region and developmental time points (mean±s.e.m.) in Csf1riCre Rosa26YFP embryos (upper panel). Number of YFP+ AA4.1+ Kit+ CD45low cells per embryonic region and developmental time points (mean±s.e.m.) in Csf1riCre Rosa26YFP embryos (lower panel). e, AA4.1 and Kit expression on YFP+ cells from Csf1riCre Rosa26YFP embryos (upper panel) and from Csf1rMeriCreMer Rosa26YFP embryos pulsed with OH-TAM at E8.5 (lower panel).
Extended Data Figure 2
Extended Data Figure 2. Fate mapping analysis of Csf1r-expressing cells.
a, Experimental design for fate mapping analysis of Csf1r-expressing cells. Arrows indicate analysed time points b, YFP expression on live cells from Csf1rMeriCreMer Rosa26YFP embryos pulsed at E6.5 with OH-TAM and analysed at E10.5 (n=2) and E12.5 (n=4). c, Percentage of YFP+ cells among Kit+ CD45low cells (YFP labelling efficiency) per organ/region (mean±s.e.m.). Upper panel, Csf1riCre Rosa26YFP embryos (E8.25, n=7; E8.5, n=4; E9.5, n=16; E10.25, n=9; E10.5, n=5; E11.5, n=8; E12.5, n=5); lower panel Csf1rMeriCreMer Rosa26YFP embryos pulsed at E8.5 (E9.5, n=3; E10.25, n=3; E10.5, n=4; E11.5, n=4; E12.5, n=9). e, Percentage of YFP+ cells among AA4.1+ Kit+ CD45low cells (YFP labelling efficiency) per embryonic organ/region and developmental time points (mean±s.e.m.). Upper panel, Csf1riCre Rosa26YFP embryos; lower panel: Csf1rMeriCreMer Rosa26YFP embryos pulsed at E8.5.
Extended Data Figure 3
Extended Data Figure 3. Csf1r+ progenitors have erythro-myeloid potential ex vivo.
a, Sorting strategy for CFU-C (colony forming unit-culture) assays for E9 Csf1riCre Rosa26YFP YS (upper panel) and E12.5 fetal liver from Csf1rMeriCreMer Rosa26YFP embryos pulsed with OH-TAM at E8.5 (lower panel). Dead cells were excluded based on Hoechst 33258 incorporation and, after doublet exclusion, cells were gated based on CD45 and Kit expression. AA4.1+ Kit+ CD45low and YFP+ AA4.1+ Kit+ CD45low cells were isolated from Cre- and Cre+ embryos respectively. b, Mean CFU-C (colony forming unit-culture) frequency from three independent experiments each of E9 Csf1riCre Rosa26YFP YS and E12.5 fetal liver from Csf1rMeriCreMer Rosa26YFP embryos pulsed with OH-TAM at E8.5. CFU-erythroid and/or megakaryocyte (E/Mk); CFU-granulocyte and/or monocyte/macrophage (G/M); CFU-mix, at least three of the following: G, E, M and Mk. c, Morphological validation of colony types obtained from E9 YS Csf1riCre YFP+ AA4.1+ Kit+ CD45low CFU-C assays. Representative images from May-Grünwald-Giemsa stained cytospin preparations of Mixed, E/Mk and G/M colonies. Black arrowhead: macrophages; Granulocyte pathway: blue arrows: Erythroid and Megakaryocyte pathway: red arrows. Scale bar, 10μm.
Extended Data Figure 4
Extended Data Figure 4. Analysis of Csf1r reporter expression in fetal macrophages and red blood cells in Csf1riCre Rosa26YFP.
a, F4/80 and CD11b expression on YFP+ CD45+ from YS, head (brain for E11.5), limbs and liver of Csf1riCre Rosa26YFP embryos (E8.5, n=4; E9.5, n=16; E10.5, n=5; E11.5, n=9; E12.5, n=5). Dashed line represent FMO (fluorescence minus one) control. b, Percentage of macrophages (F4/80bright) among YFP+ cells, mean±s.e.m., in Csf1riCre Rosa26YFP embryos (left) and Csf1rMeriCreMer Rosa26YFP embryos pulsed with OH-TAM at E8.5 (right). See also Extended Data Table 1. c, Percentage of YFP+ cells among F4/80bright cells (YFP labelling efficiency) per embryonic organ/region and developmental time points (mean±s.e.m.). Left panel, Csf1riCre Rosa26YFP embryos (E8.25, n=7; E8.5, n=5; E9.5, n=15; E10.25, n=9; E10.5, n=5; E11.5, n=9; E12.5, n=5); right panel: Csf1rMeriCreMer Rosa26YFP embryos pulsed at E8.5 (E9.5, n=3; E10.25, n=3; E10.5, n=4; E11.25, n=4; E12.5, n=9). d, YFP expression in erythrocytes (CD45- Ter119+) from YS and fetal liver of Csf1riCre Rosa26YFP embryos (left) and Csf1rMeriCreMer Rosa26YFP embryos pulsed with OH-TAM at E8.5 (right).
Extended Data Figure 5
Extended Data Figure 5. Analysis of Flt3 reporter expression in blood leucocytes, stem/progenitor cells, fetal red blood cells, and adult liver, lung and spleen in Flt3Cre Rosa26YFP mice.
a. YFP labelling efficiency in blood lineages at different embryonic and adult time points (E14.5, n=9; E16.5, n=9; E18.5, n=7; P8, n=7; 4-week-old, n=6; 12 week-old, n=9; 40 week-old, n=7) in Flt3Cre Rosa26YFP mice are shown. Lymphocytes were gated as CD3+/CD19+, Granulocytes (CD11b+ Gr1+ CD115-), Gr1+ monocytes (CD11b+ Gr1+ CD115+), Gr1- monocytes (CD11b+ Gr1- CD115+) and Red Blood Cells (RBCs, CD45- Ter119+). b, YFP labelling efficiency in bone marrow LT-HSC, ST-HSC, MPP and Lin- Sca1- Kit+ progenitors in 4 (n=3) and 12 week-old (n=6) Flt3Cre Rosa26YFP mice. c, YFP labelling efficiency in fetal liver RBC progenitors (CD45+ Ter119+) and RBCs (CD45- Ter119+) in Flt3Cre Rosa26YFP mice (E14.5, n=5; E16.5, n=5; E18.5, n=7) and comparison of YFP labelling efficiency in fetal liver and blood RBCs in Flt3Cre Rosa26YFP mice at E14.5 (n=5), E16.5 (n=5) and E18.5 (n=7). d, Expression of Gr1 and MHC II, Ly-6G and Siglec-F, CD11c and CD64, and Nkp46 and CD19 among F4/80low CD11bhigh myeloid cells in the liver. Histograms represent Flt3Cre YFP labelling efficiency in the following defined populations: Granulocytes (Gr1+ MHC II- or Ly-6G+), Eosinophils (Siglec-F+), Dendritic cells (CD11c+), B cells (CD19+) and NK cells (Nkp46+) (n=3). e, Analysis of F4/80low CD11bhigh myeloid cells in the lung as in (b). f, Analysis of F4/80low CD11bhigh myeloid cells in the spleen as in (b). g, Expression of CD64 in F4/80bright macrophages and F4/80low myeloid cells in the liver, lung and spleen (FMO, Fluorescence minus one).
Extended Data Figure 6
Extended Data Figure 6. Characterisation of fetal F4/80low CD11bhigh myeloid cells in liver, lung and skin.
a. F4/80, Kit, CD11b and Gr1 expression on YFP+ CD45+ cells in the fetal liver at E14.5 in Csf1rMeriCreMer Rosa26YFP embryos pulsed at E8.5 (left panel). Representative images of May-Grünwald-Giemsa stained cytospin preparations of fetal liver YFP+ F4/80bright and YFP+ CD11bhigh cells sorted from E14.5 Csf1rMeriCreMer Rosa26YFP embryos pulsed with OH-TAM at E8.5 (right panel). Scale bar,10μm. b, c, F4/80, CD11b, Gr1 and Siglec F expression on CD45+ cells in the embryonic and post natal lung (b) and skin (c) in Csf1rMeriCreMer Rosa26YFP embryos pulsed with OH-TAM at E8.5 (green) and Flt3Cre Rosa26YFP embryos (orange). Representative images of May-Grünwald-Giemsa stained cytospin preparations of lung YFP+ F4/80bright and YFP+ CD11bhigh F4/80low (b) and skin YFP+ F4/80bright and YFP+ Kit+ F4/80- CD11b- mast cells (c) sorted from E18.5 Flt3Cre Rosa26YFP embryos and E16.5 Csf1rMeriCreMer Rosa26YFP embryos pulsed with OH-TAM at E8.5. Scale bar 10μm.
Extended Data Figure 7
Extended Data Figure 7. Adult BM transplantation reconstitutes the hematopoietic system but does not replace tissue resident F4/80bright macrophages.
a, Schematic representation of transplantation experiments. LT-HSC isolated from bone marrow of panRosa26YFP donor mice were injected into Rag2-/-γc-/- KitW/Wv recipients (approx. 1000 cells/recipient). Eight weeks after transplantation stem cells, myeloid progenitors, monocytes and macrophages of recipient mice were analysed for donor chimerism. b, Long-term or short-term hematopoietic stem cells (LT-HSC, ST-HSC), multipotent progenitors (MPP), common myeloid progenitors (CMP), granulocyte-monocyte progenitors (GMP), megakaryocyte-erythrocyte progenitors (MEP), and circulating Ly6Chi and Ly6Clo monocytes were isolated from transplanted Rag2-/-γc-/-KitW/Wv mice and analysed for YFP expression. c, F4/80bright macrophages and F4/80low myeloid cells in spleen, liver, lung, pancreas, epidermis and brain were analysed for YFP expression.
Extended Data Figure 8
Extended Data Figure 8. Analysis of fetal stem/progenitor cells and fetal macrophages in Tie2MeriCreMer Rosa26YFP embryos pulse-labelled from E6.5 to E10.5.
a, Experimental design for fate mapping analysis of Tie2MeriCreMerRosa26YFP embryos pulse-labelled at E6.5, or E7.5, or E8.5, or E9.5 or E10.5. b, c, Representative flow cytometry of fetal liver stem/progenitor cells (b) and of fetal macrophages (c) in the yolk sac, head region, and embryo body at E12.5, injected at E6.5 or at E10.5. d, Representative images of May-Grünwald-Giemsa stained cytospin preparations of sorted YFP+ and YFP- CD45+ F4/80bright macrophages of the embryo proper or the head region of E13.5 Tie2MeriCreMerRosa26YFP embryos pulsed at E7.5. Scale bar, 10μm e, Quantification of the percentage of YFP+ stem/progenitor cells in the fetal liver and macrophages in yolk sac, brain (head) and embryo body at E12.5. Embryos were labelled at E6.5 (n=5), or E7.5 (n=7), or E8.5 (n=4), E9.5 (n=5) or E10.5 (n=7) and analysed at E12.5 (mean±s.d.).
Extended Data Figure 9
Extended Data Figure 9. Transplantation of YFP+ fetal liver LT-HSC from Tie2MeriCreMerRosa26YFP into Rag2-/- γc-/-KitW/Wv mice.
a, Experimental design for pulse-labelling and LT-HSC sort from Tie2MeriCreMerRosa26YFP embryos pulsed at E7.5. b, Fetal livers of E12.5 embryos pulsed at E7.5 were harvested, YFP+ LSK CD150+CD48- LT-HSC were sorted by flow cytometry and 10 LT-HSC were injected into Rag2-/-γc-/-KitW/Wv recipients. c, Blood analysis of recipients 16 week after LT-HSC transplantation. Donor-derived (YFP+) and recipient-derived (YFP-) blood cells were analysed for expression of CD19, CD3, CD11b, and Gr-1. One representative example is shown.
Extended Data Figure 10
Extended Data Figure 10. Analysis of E9.5 YS progenitor cells in Tie2MeriCreMer Rosa26YFP embryos pulse-labelled at E7.5.
a, Experimental design for fate mapping analysis of Tie2-expressing cells in Tie2MeriCreMerRosa26YFP embryos. Embryonic cells were pulse-labelled by Tamoxifen (TAM) administration into pregnant Tie2MeriCreMer mice at E7.5. Yolk sac (YS) and embryo proper (EP) of E9.5 Tie2MeriCreMerRosa26YFP embryos were analysed by flow cytometry. b, Quantification of total living cells and YFP+ living cells in YS and EP of analysed embryos (mean±s.d., n=5). c, Flow cytometry analysis of Kit+ CD45low cells among total living cells (black) or living YFP+ cells (blue) in YS and EP of a representative E9.5 Tie2MeriCreMerRosa26YFP embryo (left) and quantification of all analysed embryos (right; mean±s.d., n=5). d, Analysis of F4/80+ fetal macrophages among CD45+ cells (black) or YFP+ CD45+ cells (blue) in YS and EP (mean±s.d., n=5) and quantification of all analysed embryos (right; mean±s.d., n=5). e, Percentage of YFP+ cells (YFP labelling efficiency) among live cells, Kit+ CD45low, CD45+ Kit- cells and F4/80+ cells from the YS and EP of E9.5 Tie2MeriCreMerRosa26YFP embryos pulsed at E7.5.
Figure 1
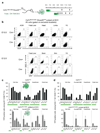
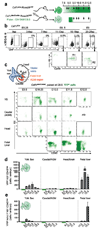
Figure 1. E8.5 Csf1r+ progenitors originate in the yolk sac and expand in the fetal liver.
a, Fate-mapping analysis of Csf1r-expressing cells. Arrows indicate time points for analysis, and green shades the genetic labelling period. b, YFP expression on live cells from Csf1riCre Rosa26YFP yolk sac (YS), separated by somite pairs between E8.25 and E9 (0sp, n=3; 3/6sp, n=3; 7-9sp, n=5; 11-13sp, n=3; 16-18sp, n=4; 20-25sp, n=4) (upper panels), and Kit and CD45 expression on YFP+ cells (lower panels). R1 indicates Kit+ CD45low, and R2 indicates Kit- CD45+ cells. c, Schematic representation of sites analysed in mouse embryos: YS, AGM region, fetal liver and head. Kit and CD45 phenotype of YFP+ cells from Csf1rMeriCreMer Rosa26YFP embryos pulsed with OH-TAM at E8.5 (E9.5, n=3; E10.25, n=3; E10.5, n=4; E11.25, n=4; E12.5, n=9). d, Number of YFP+ Kit+ CD45low cells (R1 in panel b) per organ or region (mean ± s.e.m.) in Csf1rMeriCreMer Rosa26YFP embryos pulsed at E8.5. e, Number of YFP+ AA4.1+ Kit+ CD45low cells per embryonic region and time points (mean ± s.e.m.) in Csf1rMeriCreMer Rosa26YFP embryos pulsed at E8.5. See also Supplementary Table 1 and Extended Data Figs. 1 and 2.
Figure 2
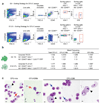
Figure 2. E8.5 Csf1r+ progenitors differentiate into myeloid cells and red blood cells in the fetal liver.
a, Distribution of mixed (Mix), G/M, and E/Mk CFU-C from unsorted, AA4.1+ Kit+ CD45low and YFP+ AA4.1+ Kit+ CD45low cells from E9 YS from Csf1riCre Rosa26YFP and E12.5 fetal liver from Csf1rMeriCreMer Rosa26YFP embryos pulsed with OH-TAM at E8.5 (three independent experiments each). CFU-erythroid and/or megakaryocyte (E/Mk); CFU-granulocyte and/or monocyte/macrophage (G/M); CFU-mix, at least three of the following: G, E, M and Mk. See also Extended Data Fig. 3. b, F4/80 and CD11b expression on YFP+ CD45+ from YS, head (brain for E11.5), limbs and liver of Csf1rMeriCreMer Rosa26YFP embryos pulsed with OH-TAM at E8.5 and analysed on E9.5 (n=3), E10.5 (n=4), E11.5 (n=4), and E12.5 (n=9); Dashed lines represent FMO (fluorescence minus one) control. See also Extended Data Fig. 4. c, F4/80, CD11b, Gr1, Ly-6G and Ly-6C expression in fetal liver CD45+ YFP+ cells from Csf1rMeriCreMer Rosa26YFP embryos pulse-labelled at E8.5, and analysed on E12.5 (n=9) and E16.5 (n=14). May-Grünwald-Giemsa stained cytospin preparations of fetal liver YFP+ F4/80bright and YFP+ CD11bhigh cells sorted from E16.5 Csf1rMeriCreMer Rosa26YFP embryos pulsed with OH-TAM at E8.5. See also Extended Data Fig. 6a for sorted cells from E14.5 Csf1rMeriCreMer embryos. Scale bar, 10μm. d, YFP labelling efficiency (%) among red blood cells in fetal liver from Csf1rMeriCreMer Rosa26YFP embryos pulsed with OH-TAM at E8.5, mean ± s.e.m. (E11.5, n=4; E12.5, n=9; E14.5, n=5; E16.5, n=11; E18.5, n=4).
Figure 3
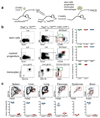
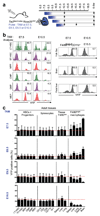
Figure 3. Fetal liver HSC-derived Flt3+ progenitors give rise to monocytes and granulocytes in late embryos and adults but do not replace YS-derived macrophages.
a, F4/80, Kit, CD11b and Gr1 expression on total CD45+ cells (black) and YFP+ CD45+ cells from Csf1rMeriCreMer Rosa26YFP embryos pulsed at E8.5 (green) in the FL at the indicated days of embryonic development (E14.5, n=5; E16.5, n= 10; E18.5, n=9). F4/80, Kit, CD11b and Gr1 expression on YFP+ CD45+ cells from Flt3Cre Rosa26YFP embryos (orange) (E14.5, n=7; E16.5, n=6; E18.5, n=6). F4/80 and CD11b expression on CD45+ cells in Myb-/- embryos (E14.5, n=4; E16.5, n= 7). b, YFP labelling efficiency in Kit+ lin- cells, CD11bhigh F4/80low cells (characterised in Extended Data Fig. 5) and F4/80bright macrophages (Kupffer cells in adults) in fetal and adult Flt3Cre Rosa26YFP liver (first panel on the left). YFP labelling efficiency in blood monocytes, brain microglia (CD45low F4/80+) and CD45+ F4/80+ brain macrophages in Flt3Cre Rosa26YFP pups and mice (second panel). YFP labelling efficiency in alveolar macrophages (F4/80bright Siglec-F+ CD11b-) and F4/80low CD11bhigh myeloid cells in Flt3Cre Rosa26YFP lungs (third panel). YFP labelling efficiency in epidermal Langerhans cells (LCs) and dermal CD11bhigh (MHC II+ EpCAM-) myeloid cells in Flt3Cre Rosa26YFP skin (fourth panel). See Extended Data Fig. 6b and c. Mean ± s.e.m.; P8, n=3; 4-week-old, n=6; 12-week-old, n=11-14; 40-week-old, n=7; 1-year-old, n=3).w, week; y, year. c, Representative images of May-Grünwald-Giemsa stained cytospin preparations of YFP+ CD11bhigh F4/80low cells sorted from E18.5 Flt3Cre Rosa26YFP fetal liver. Scale bar, 10μm.
Figure 4
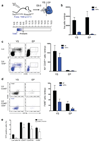
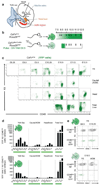
Figure 4. Fetal macrophages and adult tissue-resident macrophages originate from Tie2-expressing progenitors prior to E10.5.
a, Fate mapping analysis of Tie2-expressing cells after tamoxifen (TAM) administration at E7.5, or E8.5, or E9.5 or E10.5. Arrows indicate time points for analysis. b, Flow cytometric analysis of fetal liver long-term or short-term hematopoietic stem cells (LT-HSCs, ST-HSCs), multipotent progenitors (MPPs), common myeloid progenitors (CMPs), granulocyte-monocyte progenitors (GMPs), megakaryocyte-erythrocyte progenitors (MEPs) (left panel) and of fetal macrophages (right panel) in the yolk sac, brain, and fetal liver. Time points of labelling (E7.5 (n=7); E10.5 (n=7)) and analysis are indicated, and for each experiment one representative analysis is shown. See Extended Data Fig. 8 for quantitative analysis. c, Frequencies of labelled HSCs and progenitor cells, splenocytes, and F4/80low CD11bhigh myeloid cells and F4/80bright resident macrophages in spleen, liver lung, epidermis and brain were analysed (mean ± s.d.) from 6-8-week-old Tie2MeriCreMer animals pulse-labelled at E7.5 (n=4), E8.5 (n=4), E9.5 (n=4) or E10.5 (n=6).

Similar articles

Cited by

References

    1. Orkin SH, Zon LI. Hematopoiesis: an evolving paradigm for stem cell biology. Cell. 2008;132:631–644. doi: 10.1016/j.cell.2008.01.025. - DOI - PMC - PubMed
    1. Smith LG, Weissman IL, Heimfeld S. Clonal analysis of hematopoietic stem-cell differentiation in vivo. Proceedings of the National Academy of Sciences of the United States of America. 1991;88:2788–2792. - PMC - PubMed
    1. Cumano A, Godin I. Ontogeny of the hematopoietic system. Annual review of immunology. 2007;25:745–785. doi: 10.1146/annurev.immunol.25.022106.141538. - DOI - PubMed
    1. Schulz C, et al. A lineage of myeloid cells independent of Myb and hematopoietic stem cells. Science. 2012;336:86–90. doi: 10.1126/science.1219179. - DOI - PubMed
    1. Yona S, et al. Fate mapping reveals origins and dynamics of monocytes and tissue macrophages under homeostasis. Immunity. 2013;38:79–91. doi: 10.1016/j.immuni.2012.12.001. - DOI - PMC - PubMed

Publication types

MeSH terms

Substances