. 2015 Jan 30;290(5):2969-82.
doi: 10.1074/jbc.M114.585703. Epub 2014 Nov 25.

Acceleration of α-synuclein aggregation by exosomes

Affiliations

Acceleration of α-synuclein aggregation by exosomes

Marie Grey et al. J Biol Chem. .

Abstract

Exosomes are small vesicles released from cells into extracellular space. We have isolated exosomes from neuroblastoma cells and investigated their influence on the aggregation of α-synuclein, a protein associated with Parkinson disease pathology. Using cryo-transmission electron microscopy of exosomes, we found spherical unilamellar vesicles with a significant protein content, and Western blot analysis revealed that they contain, as expected, the proteins Flotillin-1 and Alix. Using thioflavin T fluorescence to monitor aggregation kinetics, we found that exosomes catalyze the process in a similar manner as a low concentration of preformed α-synuclein fibrils. The exosomes reduce the lag time indicating that they provide catalytic environments for nucleation. The catalytic effects of exosomes derived from naive cells and cells that overexpress α-synuclein do not differ. Vesicles prepared from extracted exosome lipids accelerate aggregation, suggesting that the lipids in exosomes are sufficient for the catalytic effect to arise. Using mass spectrometry, we found several phospholipid classes in the exosomes, including phosphatidylcholine, phosphatidylserine, phosphatidylethanolamine, phosphatidylinositol, and the gangliosides GM2 and GM3. Within each class, several species with different acyl chains were identified. We then prepared vesicles from corresponding pure lipids or defined mixtures, most of which were found to retard α-synuclein aggregation. As a striking exception, vesicles containing ganglioside lipids GM1 or GM3 accelerate the process. Understanding how α-synuclein interacts with biological membranes to promote neurological disease might lead to the identification of novel therapeutic targets.

Keywords: Amyloid; Exosome; Fibril; Fluorescence; Lipid; Mass Spectrometry (MS); Membrane; Parkinson Disease; Protein Aggregation; {alpha}-Synuclein.


Figures

FIGURE 1.
FIGURE 1.
Characterization of exosomes. A, whole cell lysates and exosomes were subjected to Western blot analysis with antibodies against the proteins indicated. B, exosomes were treated with 0.25% trypsin ± 0.1% saponin before Western blotting with antibodies against α-syn, GAPDH (cytosolic protein), and Alix (membrane protein). C, relative levels of α-syn in cell lysates compared with that secreted, either free or in exosomes, was analyzed by Western blotting. Cell lysate represents 1% of total cells; media (−exosomes) represents 10% of culture medium TCA-precipitated after exosome isolation, and 50% of total exosomes isolated were loaded. D, dynamic light scattering of exosomes from N2a cells with or without overexpressing-type α-syn shows vesicles of around 100 nm in diameter (analyzed by number). E, isolated exosomes from N2a cells (blue) or N2a cells overexpressing wild-type α-syn (red) were analyzed by NanoSight nanotracking analysis.
FIGURE 2.
FIGURE 2.
Formation of α-syn fibrils. 5 μl of α-syn fibrils in 10 mm MES, pH 5.5, with 140 mm NaCl, unless otherwise stated) was added to the glow-discharged grid for cryo-TEM imaging. A, examples of typical α-syn fibrils formed at pH 5.5. B, example of a typical α-syn fibril formed at pH 7.5.
FIGURE 3.
FIGURE 3.
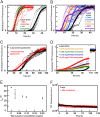
Aggregation kinetics of α-syn in the presence of exosomes. Aggregation kinetics for 30 μm α-syn and β-syn was followed by ThT fluorescence in the presence and absence of exosomes in 10 mm MES, pH 5.5, with 140 mm NaCl. The averages of 4–8 replicate traces are shown in boldface with individual traces dashed below. A, aggregation of α-syn (black) with 0.25 mg/ml exosomes from N2a cells (red) or N2a cells overexpressing α-syn (green) show a distinct difference in lag time. Data were collected at 100 rpm. B, aggregation of α-syn (black) with 0.25 mg/ml exosomes from cells overexpressing disease-associated mutant α-syn (purple A53T, orange A30P, and light blue E46K) also exhibit a significantly shorter lag time than α-syn alone. Data were collected at 100 rpm. C, aggregation of α-syn (black) with 0.25 mg/ml exosomes from N2a cells (red) under quiescent conditions. D, dose dependence aggregation assay of α-syn in the presence of different exosome concentrations varying from 0–0.25 mg/ml. E, lag times, corresponding to 10% of maximum intensity, taken from the conditions depicted in D pointing again toward a significantly accelerated fibrillation when in the presence of exosomes. F, control experiment with β-syn, nonaggregating α-syn homologue protein, which remained unaffected in the presence of 0.25 mg/ml exosomes during the time frame assayed.
FIGURE 4.
FIGURE 4.
α-syn monomer concentration during the aggregation process. Normalized aggregation kinetics for 30 μm α-syn (black line) in the presence of 0.25 mg/ml exosomes (red line) followed by ThT fluorescence in 10 mm MES, pH 5.5, with 140 mm NaCl. The average traces are shown in bold. In parallel to the ongoing aggregation process, solubility changes of α-syn alone (black squares) and in the presence of 0.25 mg/ml exosomes (red squares) were monitored. Samples were collected at different stages of the aggregation profile and centrifuged, and absorbance measurements were preformed to the supernatant. Each time point therefore represents an average value of at least three repeated absorbance measurements of soluble monomeric α-syn with respective standard deviation bar represented. Well depicted is the correlation between monomer depletion and fibril elongation in the presence and absence of exosomes.
FIGURE 5.
FIGURE 5.
Lipid identification by mass spectrometry. Fragmentation of GM species m/z 1354.8 with a neutral loss of Neu5Ac (−291.1), Neu5Ac + GlcNAc (−494.2), Neu5Ac + GlcNAc + Hex (−656.2), and Neu5Ac + GlcNAc + 2Hex (−818.3) marked in circles. Insets show lipid structures as indicated.
FIGURE 6.
FIGURE 6.
Aggregation kinetics of α-syn in the presence of SUVs. Aggregation kinetics for α-syn was measured by ThT fluorescence in the presence of SUVs in 10 mm MES, pH 5.5, with 140 mm NaCl. The averages of eight replicate traces are shown in bold with individual traces dashed below. A, aggregation of 30 μm α-syn (black) with 0.2 mm DOPC SUVs (red). B, aggregation of 30 μm α-syn (black) with 0.2 mm 30% DOPS SUVs (green) or 0.2 mm 6% cardiolipin SUVs (blue). C, aggregation of 30 μm α-syn (black) with 0.2 mm 15% sphingosine SUVs (orange). All mixtures are based on DOPC with addition of the indicated lipid. In all instances, the aggregation is retarded or shows no significant change in lag time when the lipid vesicles are added. D, aggregation of 30 μm α-syn alone (black) with extracted exosome lipid SUVs (green). Addition of SUVs made from extracted exosome lipids was the only model system studied that catalyzed the aggregation kinetics of α-syn.
FIGURE 7.
FIGURE 7.
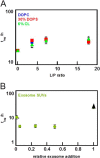
Effect of lipid to protein ratio on aggregation lag time. 30 μm α-syn was incubated in the presence of different concentrations of SUVs in 10 mm MES, pH 5.5, with 140 mm NaCl. The lag time is defined as the time when 10% of the maximum intensity is reached, and the error bars represent the standard deviation from eight replicates. All mixtures are based on DOPC with addition of the indicated lipid. A, lag time dependence for varying lipid to protein ratio for pure DOPC SUVs (blue), 30% DOPS SUVs (red), and 6% cardiolipin SUVs (green). Data collected at 100 rpm. B, lag time dependence for varying lipid to protein ratio for SUVs made from exosome lipids reported in relative lipid ratio. Addition of exosome SUVs decrease lag times until a threshold is reached and where the aggregation does not start within the experimental time frame (black arrowhead). Data were collected at 100 rpm.
FIGURE 8.
FIGURE 8.
Aggregation kinetics of α-syn in the presence of ganglioside SUVs or α-syn seeds. Aggregation kinetics for α-syn was measured by ThT fluorescence in the presence of SUVs or α-syn seeds in 10 mm MES, pH 5.5, with 140 mm NaCl. The averages of eight replicate traces are shown in bold with individual traces dashed below. All mixtures are based on DOPC with addition of the indicated lipid. A, aggregation of α-syn (black) with 0.2 mm 10% GM1 SUVs (red) or 0.5 mm 10% GM1 (green) at 100 rpm. The biphasic behavior observed for 0.5 mm 10% GM1 SUVs is not reproduced in every experiment and may be due to the after-reaction of the formed fibrils (bundling and sedimentation, etc.) that perturbs the ThT fluorescence. B, aggregation of α-syn (black) with 0.1 mm 10% GM1 SUVs (blue) or 0.5 mm 10% GM1 (green) under quiescent conditions and in 96-well nonbinding pegylated surface plates. C, aggregation of α-syn (black) with 0.1 mm (blue), 0.2 mm (red), or 0.5 mm 10% GM3 SUVs (green) at quiescent conditions. D, aggregation of α-syn (black) with 0.1% (orange) or 1% seeds (light green) at 100 rpm.
FIGURE 9.
FIGURE 9.
Aggregation kinetics with seeds formed in the presence or absence of exosomes. Aggregation of α-syn (black) was measured by ThT fluorescence in 10 mm MES, pH 5.5, with 140 mm NaCl in the presence of 0.1 or 1% seeds formed either with (shades of green) or without (shades of red) exosomes. The averages of four replicate traces are shown in bold with individual traces dashed below. Data were collected under quiescent conditions and in nonbinding pegylated surface plates.
FIGURE 10.
FIGURE 10.
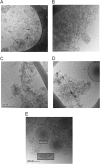
cryo-TEM analysis of fibrils. 5 μl of α-syn fibrils formed in 10 mm MES, pH 5.5, with 140 mm NaCl was added to the glow-discharged grid for cryo-TEM imaging. A, exosomes isolated from N2a cells overexpressing wild-type α-syn reveal spherical unilamellar vesicles with the presence of darker gray areas inside and on top of the vesicles (exemplified by arrow). B, when recombinant α-syn is mixed with exosomes from cells overexpressing α-syn, an immediate increase in “gray shadows” appears in the same area of the grid as where exosomes are found. C, after 18 h of co-incubation of recombinant α-syn with exosomes from cells overexpressing wild-type α-syn fibrils associated with the exosomes are present. D, incubation of recombinant α-syn with the exosomes leads to formation of patches in the exosome membrane that are darker than the surrounding membrane (marked by arrows). E, incubation of recombinant α-syn with exosomes overexpressing α-syn at neutral pH 7.5. Here a surface decoration of the exosome membrane is observed (inset shows magnification).

Similar articles

Cited by

References

    1. Chivet M., Hemming F., Pernet-Gallay K., Fraboulet S., Sadoul R. (2012) Emerging role of neuronal exosomes in the central nervous system. Front. Physiol. 3, 145. - PMC - PubMed
    1. Bonini N. M., Giasson B. I. (2005) Snaring the function of α-synuclein. Cell 123, 359–361 - PubMed
    1. Murphy D. D., Rueter S. M., Trojanowski J. Q., Lee V. M. (2000) Synucleins are developmentally expressed, and α-synuclein regulates the size of the presynaptic vesicular pool in primary hippocampal neurons. J. neurosci. 20, 3214–3220 - PMC - PubMed
    1. Cremades N., Cohen S. I., Deas E., Abramov A. Y., Chen A. Y., Orte A., Sandal M., Clarke R. W., Dunne P., Aprile F. A., Bertoncini C. W., Wood N. W., Knowles T. P., Dobson C. M., Klenerman D. (2012) Direct observation of the interconversion of normal and toxic forms of α-synuclein. Cell 149, 1048–1059 - PMC - PubMed
    1. Schapira A. H. (2009) Neurobiology and treatment of Parkinson's disease. Trends Pharmacol. Sci. 30, 41–47 - PubMed

Publication types