. 2015 Feb 15;466(1):105-14.
doi: 10.1042/BJ20140798.

Inositol pyrophosphates regulate RNA polymerase I-mediated rRNA transcription in Saccharomyces cerevisiae

Affiliations

Inositol pyrophosphates regulate RNA polymerase I-mediated rRNA transcription in Saccharomyces cerevisiae

Swarna Gowri Thota et al. Biochem J. .

Abstract

Ribosome biogenesis is an essential cellular process regulated by the metabolic state of a cell. We examined whether inositol pyrophosphates, energy-rich derivatives of inositol that act as metabolic messengers, play a role in ribosome synthesis in the budding yeast, Saccharomyces cerevisiae. Yeast strains lacking the inositol hexakisphosphate (IP6) kinase Kcs1, which is required for the synthesis of inositol pyrophosphates, display increased sensitivity to translation inhibitors and decreased protein synthesis. These phenotypes are reversed on expression of enzymatically active Kcs1, but not on expression of the inactive form. The kcs1Δ yeast cells exhibit reduced levels of ribosome subunits, suggesting that they are defective in ribosome biogenesis. The rate of rRNA synthesis, the first step of ribosome biogenesis, is decreased in kcs1Δ yeast strains, suggesting that RNA polymerase I (Pol I) activity may be reduced in these cells. We determined that the Pol I subunits, A190, A43 and A34.5, can accept a β-phosphate moiety from inositol pyrophosphates to undergo serine pyrophosphorylation. Although there is impaired rRNA synthesis in kcs1Δ yeast cells, we did not find any defect in recruitment of Pol I on rDNA, but observed that the rate of transcription elongation was compromised. Taken together, our findings highlight inositol pyrophosphates as novel regulators of rRNA transcription.


Figures
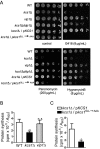
Figure 1
Figure 1. S. cerevisiae lacking Kcs1 displays a defect in translation
(A) 5-fold serial dilutions of the indicated S. cerevisiae strains were plated on YPD with or without protein synthesis inhibitors, and incubated for 2–3 days at 30°C. Data represent three independent experiments. (B) Protein synthesis was measured in the indicated S. cerevisiae strains by pulse-labelling cells for 5 min with [35S]methionine/cysteine. Radioactivity incorporated into total protein, expressed as counts per min (cpm), was normalized to the absorbance (A600) of the labelled culture. Data are means±S.E.M. (n=4). (C) Protein synthesis was measured in kcs1Δ cells expressing either native or catalytically inactive forms of Kcs1, as described in (B). Data are means±S.E.M. (n=6). P values are from a two-tailed paired t-test (*P≤0.05; **P≤0.01; n.s. not significant, P>0.05).
Figure 2
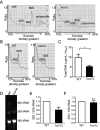
Figure 2. Ribosome content is reduced in yeast cells lacking IP7
(A) Polysomal profiles of equal concentrations of WT and kcs1Δ yeast lysates, as measured by absorbance at 254 nm (A254). The positions of 40S and 60S ribosomal subunits, 80S monosomes and polysomes are indicated. (B) Ribosomal subunit profiles of equal concentrations of WT and kcs1Δ yeast lysates. The positions of 40S and 60S subunits are indicated. Data represent two independent experiments. (C) Total RNA isolated from yeast cells, quantified by measuring A260, was normalized to the absorbance (A600) of the culture. Data are means±S.E.M. (n=6). (D–F) Total RNA (10 μg) isolated from yeast cells was resolved using denaturing agarose gel electrophoresis. (D) 35S, 25S and 18S rRNA were quantified by densitometry analysis. (E) Levels of 35S rRNA were compared with 25S rRNA and (F) levels of 25S rRNA with 18S rRNA; these ratios in kcs1Δ cells were normalized to WT cells. Data are means±S.E.M. (n=4). P values are from (C) a two-tailed paired t-test or (E, F) a one-sample t-test (*P≤0.05; n.s. not significant, P>0.05).
Figure 3
Figure 3. Synthesis of rRNA is reduced in yeast cells lacking IP7
(A) Yeast cells were labelled with [14C]uracil for the time indicated; RNA was isolated and resolved using denaturing agarose gel electrophoresis, detected by staining with ethidium bromide (lower panel) and transferred to a nylon membrane. Incorporation of radiolabelled uracil into rRNA was detected by phosphorimager scanning (upper panel). Data represent two independent experiments. (B) For the experiment described in (A), [14C]uracil incorporation into 18S rRNA (intensity of phosphorimager signal) was normalized to total 18S rRNA (intensity of ethidium bromide staining) at 5, 15 and 20 min, and these ratios in kcs1Δ cells were compared with those in WT cells. Data are means±S.E.M. (n=6). P values are from a one-sample t-test (***P≤0.001). (C) Yeast cells were labelled with [14C]uracil for 5 min and chased with excess unlabelled uracil for the time indicated. RNA was isolated, equal amounts of total RNA were resolved using denaturing agarose gel electrophoresis and the radioactivity was detected with phosphorimager scanning. The kcs1Δ blot, which had a fainter signal compared with the WT blot, was subjected to linear contrast adjustment to visualize bands. Data represent two independent experiments.
Figure 4
Figure 4. IP7 pyrophosphorylates RNA Pol I subunits
(A) Purified, GST-tagged, full-length (FL) proteins Uaf30, A34.5, and A43, and the indicated fragments of A135 and A190, were incubated with 5[β-32P]IP7. Proteins were resolved using NuPAGE and transferred to a PVDF membrane. Pyrophosphorylation was detected by phosphorimager scanning (right) and proteins were detected by Western blotting (left). (B) Purified, GST-tagged, A190 fragments were pyrophosphorylated as in (A). (C) Purified GST-tagged A190 fragments corresponding to the native sequence and the indicated serine-to-alanine point mutants were pyrophosphorylated as in (A). (D–F) Pyrophosphorylation, as in (A), of purified, GST-tagged, FL fragments, and the indicated serine-to-alanine point mutants of A43. (G) Pyrophosphorylation, as in (A), of purified GST-tagged FL in-frame deletion, a C-terminally truncated fragment and the indicated serine-to-alanine point mutants of A34.5. To improve visualization, phosphorimager scans in (A), (F) and (G) were subjected to tonal range adjustment of the whole image using Adobe Photoshop (level adjustment). The start and end amino acid numbers of protein fragments are indicated in brackets. The dividing lines between lanes in panels (A) and (F) indicate the removal of non-essential lanes from a single original gel.
Figure 5
Figure 5. RNA Pol I elongation activity is lowered in kcs1Δ yeast strain
(A) The 9.1-kb transcription unit of rDNA includes a 6.6-kb region encoding 35S pre-rRNA transcribed by RNA Pol I, a 121-bp region encoding 5S rRNA transcribed by RNA Pol III from the opposite strand and two NTSs. The 35S rDNA consists of 5′- and 3′-ETSs, two ITSs), and regions encoding the 18S, 5.8S and 25S mature rRNAs. Primers used for quantitative PCR (qPCR) are indicated by arrows. Primers 1 and 2 amplify the rDNA promoter (−174 to +57), and primers 3 and 4 amplify the 5′-ETS (+91 to +270). Probes used for transcription run-on analysis are indicated by solid lines. (B) Chromatin immunoprecipitation with GST-tagged A43, followed by qPCR with primers indicated in (A). Immunoprecipitated chromatin is expressed as a percentage of input chromatin in each sample. Data are means±S.E.M. (n=3). (C) Transcription run-on analysis using probes indicated in (A). The hybridization signals were quantified by densitometry analysis; the average intensity of the TOPO spots was considered as a background, and individual probe intensities were normalized to the genomic DNA signal. (D) These ratios in kcs1Δ cells were normalized to WT cells. Data are means±S.E.M. (n=4). P values are from (B) a two-tailed paired t-test or (D) a one-sample t-test (*P≤0.05; **P≤0.01; n.s. not significant, P>0.05).

Similar articles

Cited by

References

    1. Woolford J. L., Jr, Baserga S. J. Ribosome biogenesis in the yeast Saccharomyces cerevisiae. Genetics. 2013;195:643–681. doi: 10.1534/genetics.113.153197. - DOI - PMC - PubMed
    1. Nomura M., Nogi Y., Oakes M. Transcription of rDNA in the yeast Saccharomyces cerevisiae. In: Olson M. O. J., editor. The Nucleolus. Georgetown, TX: Landes Bioscience; 2004. pp. 128–153.
    1. Thomas G. An encore for ribosome biogenesis in the control of cell proliferation. Nat. Cell Biol. 2000;2:E71–72. doi: 10.1038/35010581. - DOI - PubMed
    1. Shears S. B. Diphosphoinositol polyphosphates: metabolic messengers? Mol. Pharmacol. 2009;76:236–252. doi: 10.1124/mol.109.055897. - DOI - PMC - PubMed
    1. Wundenberg T., Mayr G. W. Synthesis and biological actions of diphosphoinositol phosphates (inositol pyrophosphates), regulators of cell homeostasis. Biol. Chem. 2012;393:979–998. doi: 10.1515/hsz-2012-0133. - DOI - PubMed

Publication types

MeSH terms