Controlled Generation of Microspheres Incorporating Extracellular Matrix Fibrils for Three-Dimensional Cell Culture
- PMID: 25411575
- PMCID: PMC4233144
- DOI: 10.1002/adfm.201303891
Controlled Generation of Microspheres Incorporating Extracellular Matrix Fibrils for Three-Dimensional Cell Culture
Abstract
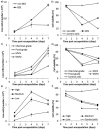
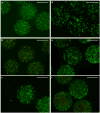
A growing body of evidence suggests that studying cell biology in classical two-dimensional formats, such as cell culture plasticware, results in misleading, non-physiological findings. For example, some aspects of cancer biology cannot be observed in 2D, but require 3D culture methods to recapitulate observations in vivo. Therefore, we developed a microsphere-based model to permit 3D cell culture incorporating physiological extracellular matrix components. Bio-electrospraying was chosen as it is the most advanced method to produce microspheres, with THP-1 cells as a model cell line. Bio-electrospraying parameters, such as nozzle size, polymer flow rate, and voltage, were systematically optimized to allow stable production of size controlled microspheres containing extracellular matrix material and human cells. We investigated the effect of bio-electrospraying parameters, alginate type and cell concentration on cell viability using trypan blue and propidium iodide staining. Bio-electrospraying had no effect on cell viability nor the ability of cells to proliferate. Cell viability was similarly minimally affected by encapsulation in all types of alginate tested (MVM, MVG, chemical- and food-grade). Cell density of 5 × 10⁶ cells ml-1 within microspheres was the optimum for cell survival and proliferation. The stable generation of microspheres incorporating cells and extracellular matrix for use in a 3D cell culture will benefit study of many diverse diseases and permit investigation of cellular biology within a 3D matrix.
Keywords: 3D cell culture; bio-electrospraying; biological models; cell encapsulation; cellular kinetics.
Figures

Similar articles
-
A three-dimensional spheroidal cancer model based on PEG-fibrinogen hydrogel microspheres.Biomaterials. 2017 Jan;115:141-154. doi: 10.1016/j.biomaterials.2016.10.052. Epub 2016 Nov 1. Biomaterials. 2017. PMID: 27889665
-
Effect of dynamic three-dimensional culture on osteogenic potential of human periodontal ligament-derived mesenchymal stem cells entrapped in alginate microbeads.J Periodontal Res. 2015 Aug;50(4):544-53. doi: 10.1111/jre.12225. Epub 2014 Sep 23. J Periodontal Res. 2015. PMID: 25251713
-
Three-dimensional culture of rabbit nucleus pulposus cells in collagen microspheres.Spine J. 2011 Oct;11(10):947-60. doi: 10.1016/j.spinee.2011.07.004. Epub 2011 Aug 16. Spine J. 2011. PMID: 21843975
-
Novel decellularized liver matrix-alginate hybrid gel beads for the 3D culture of hepatocellular carcinoma cells.Int J Biol Macromol. 2018 Apr 1;109:1154-1163. doi: 10.1016/j.ijbiomac.2017.11.103. Epub 2017 Nov 20. Int J Biol Macromol. 2018. PMID: 29157906
-
Gradient Printing Alginate Herero Gel Microspheres for Three-Dimensional Cell Culture.Materials (Basel). 2022 Mar 20;15(6):2305. doi: 10.3390/ma15062305. Materials (Basel). 2022. PMID: 35329757 Free PMC article.
Cited by
-
Matrix Degradation in Human Immunodeficiency Virus Type 1-Associated Tuberculosis and Tuberculosis Immune Reconstitution Inflammatory Syndrome: A Prospective Observational Study.Clin Infect Dis. 2017 Jul 1;65(1):121-132. doi: 10.1093/cid/cix231. Clin Infect Dis. 2017. PMID: 28475709 Free PMC article.
-
In Vitro Granuloma Models of Tuberculosis: Potential and Challenges.J Infect Dis. 2019 May 24;219(12):1858-1866. doi: 10.1093/infdis/jiz020. J Infect Dis. 2019. PMID: 30929010 Free PMC article. Review.
-
The Extracellular Matrix Regulates Granuloma Necrosis in Tuberculosis.J Infect Dis. 2015 Aug 1;212(3):463-73. doi: 10.1093/infdis/jiv076. Epub 2015 Feb 12. J Infect Dis. 2015. PMID: 25676469 Free PMC article.
-
3D Modeling of Epithelial Tumors-The Synergy between Materials Engineering, 3D Bioprinting, High-Content Imaging, and Nanotechnology.Int J Mol Sci. 2021 Jun 9;22(12):6225. doi: 10.3390/ijms22126225. Int J Mol Sci. 2021. PMID: 34207601 Free PMC article. Review.
-
Nano-fibre Integrated Microcapsules: A Nano-in-Micro Platform for 3D Cell Culture.Sci Rep. 2019 Sep 27;9(1):13951. doi: 10.1038/s41598-019-50380-0. Sci Rep. 2019. PMID: 31562351 Free PMC article.
References
-
- Pampaloni F, Reynaud EG, Stelzer EH. Nat Rev Mol Cell Biol. 2007;8:839. - PubMed
Grants and funding
LinkOut - more resources
Full Text Sources
Other Literature Sources
