. 2015 Feb;89(3):1608-27.
doi: 10.1128/JVI.02336-14. Epub 2014 Nov 19.

Identification of RISC-associated adenoviral microRNAs, a subset of their direct targets, and global changes in the targetome upon lytic adenovirus 5 infection

Affiliations

Identification of RISC-associated adenoviral microRNAs, a subset of their direct targets, and global changes in the targetome upon lytic adenovirus 5 infection

Florian Bellutti et al. J Virol. 2015 Feb.

Abstract

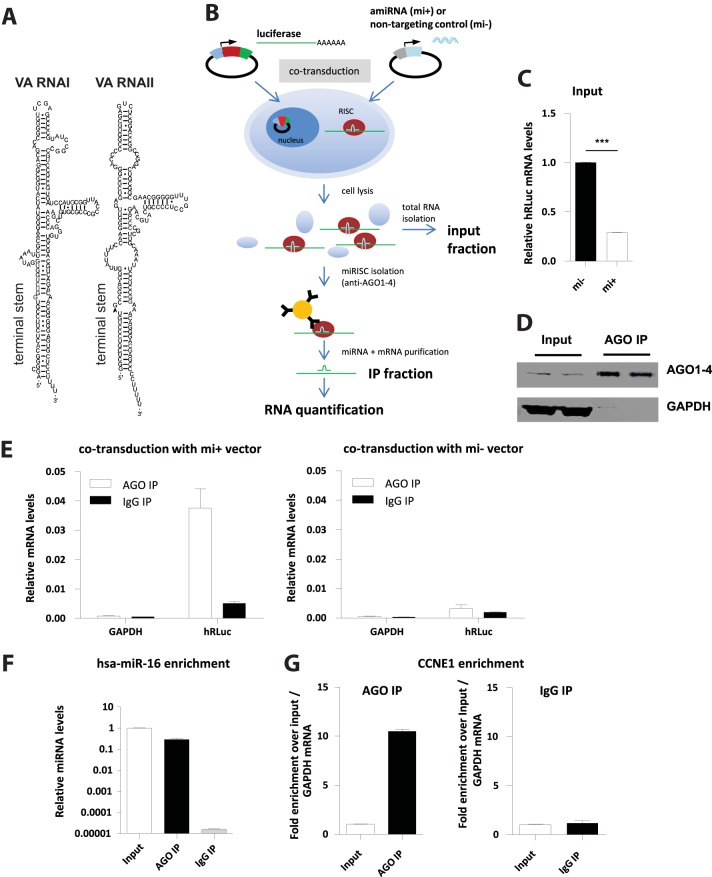
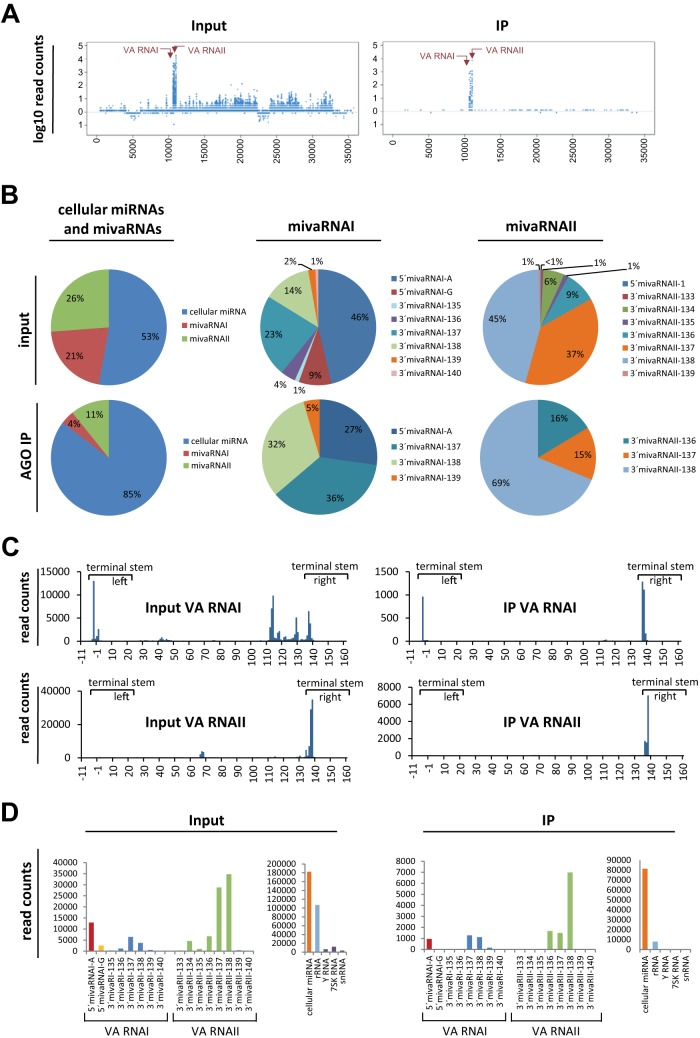
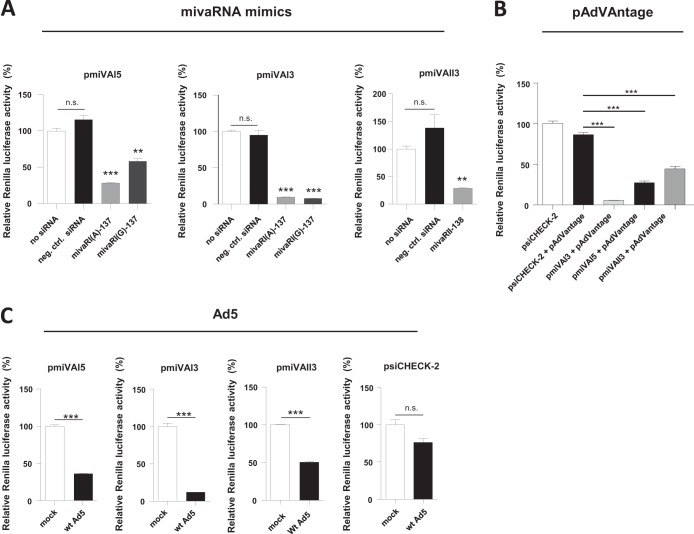
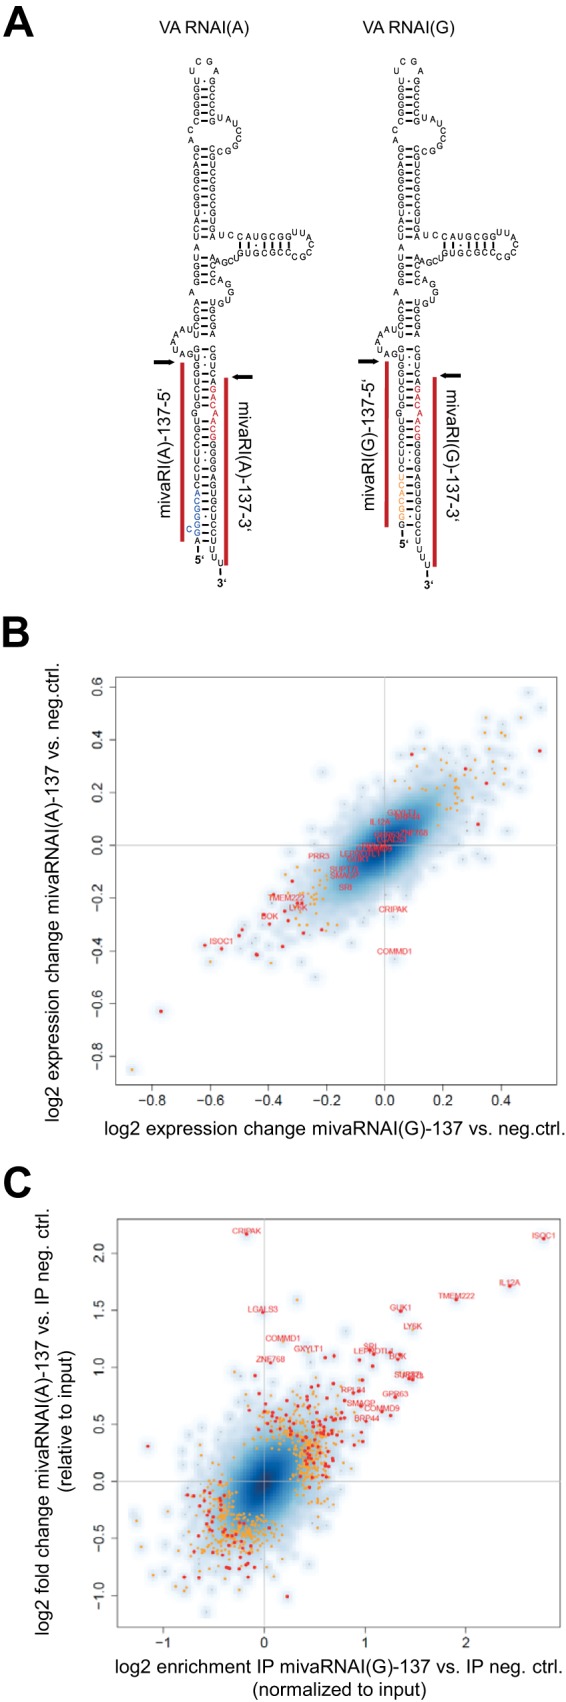
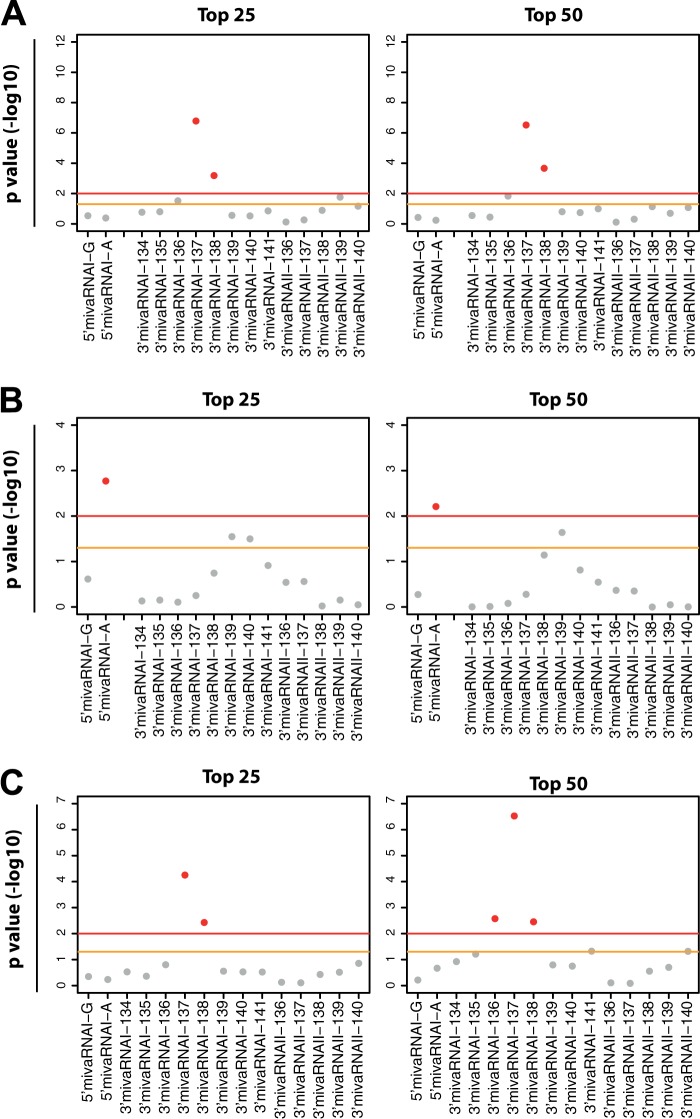
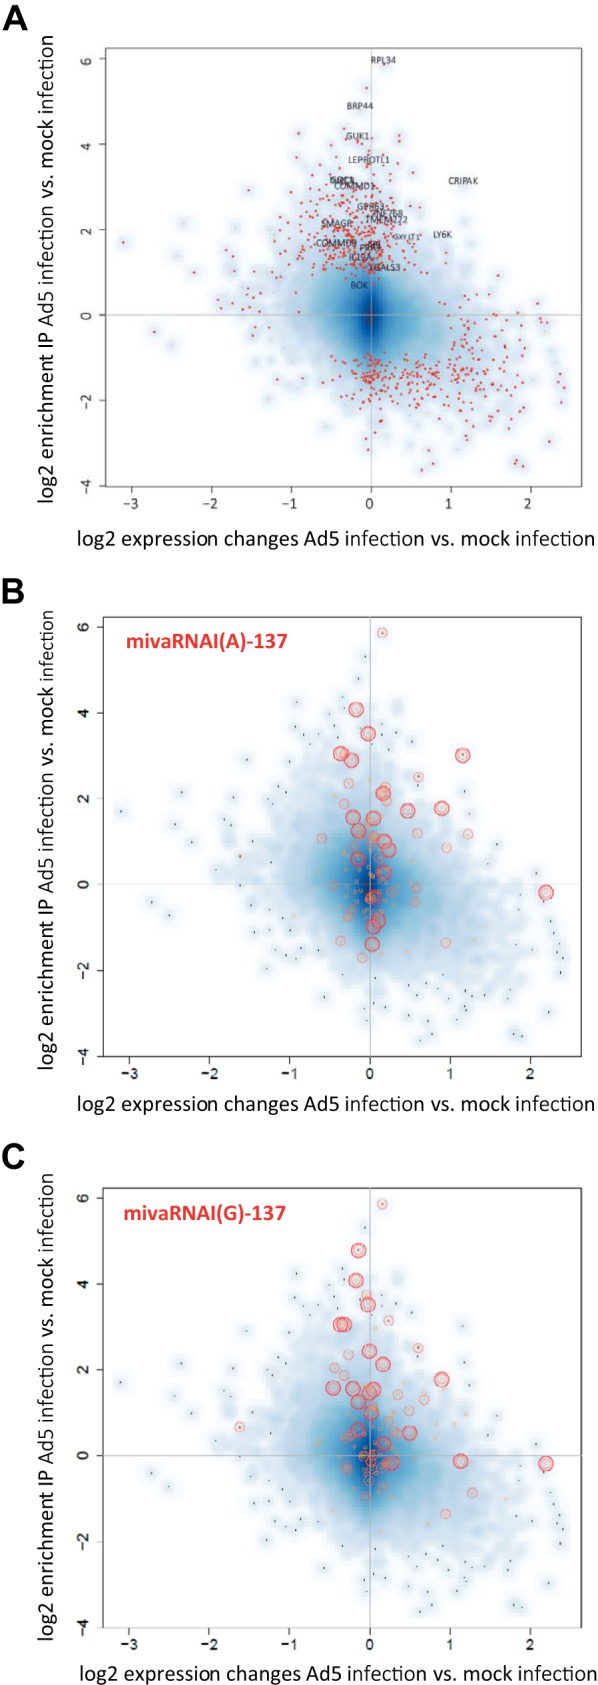
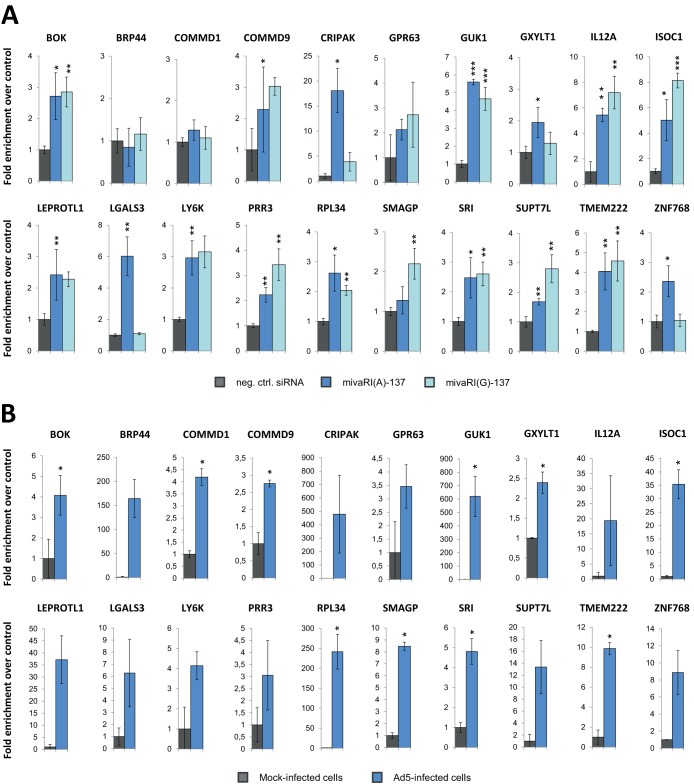
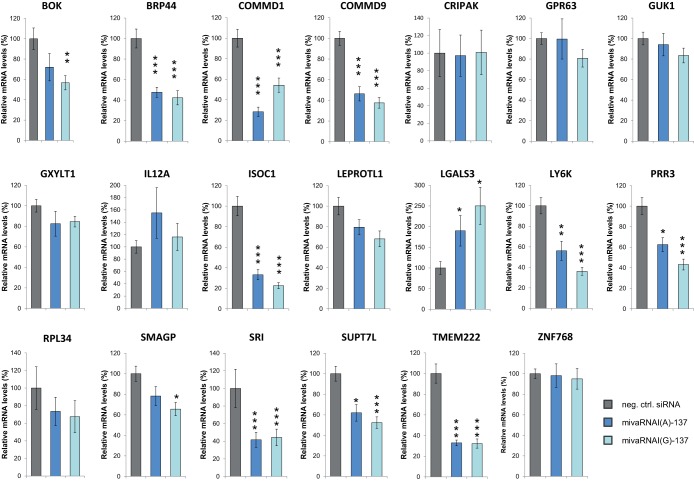
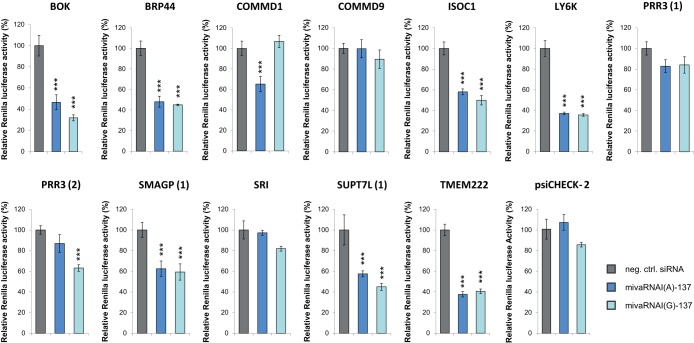
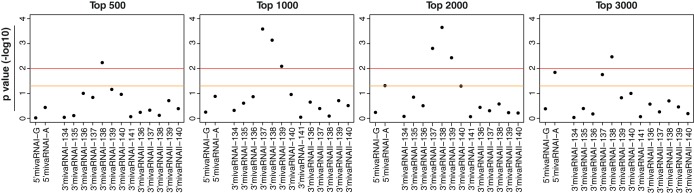
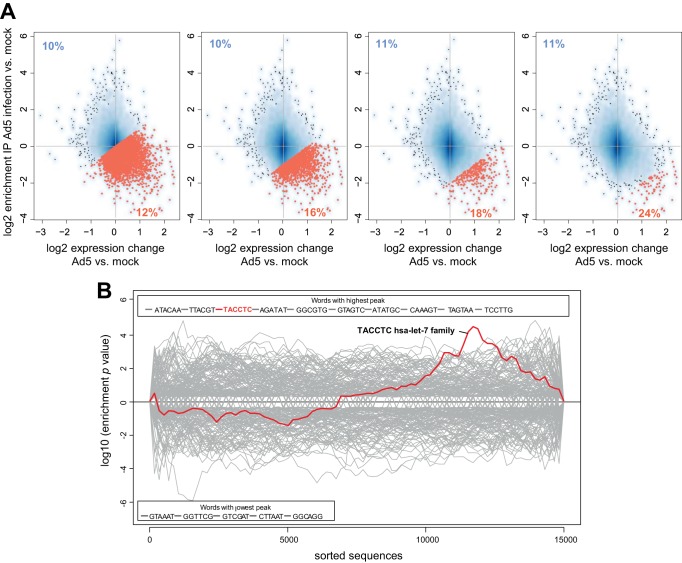
Adenoviruses encode a set of highly abundant microRNAs (mivaRNAs), which are generated by Dicer-mediated cleavage of the larger noncoding virus-associated RNAs (VA RNAs) I and II. We performed deep RNA sequencing to thoroughly investigate the relative abundance of individual single strands of mivaRNA isoforms in human A549 cells lytically infected with human adenovirus 5 (Ad5) at physiologically relevant multiplicities of infection (MOIs). In addition, we investigated their relative abundance in the endogenous RNA-induced silencing complexes (RISCs). The occupation of endogenous RISCs by mivaRNAs turned out to be pronounced but not as dominant as previously inferred from experiments with AGO2-overexpressing cells infected at high MOIs. In parallel, levels of RISC-incorporated mRNAs were investigated as well. Analysis of mRNAs enriched in RISCs in Ad5-infected cells revealed that only mRNAs with complementarity to the seed sequences of mivaRNAs derived from VA RNAI but not VA RNAII were overrepresented among them, indicating that only mivaRNAs derived from VA RNAI are likely to contribute substantially to the posttranscriptional downregulation of host gene expression. Furthermore, to generate a comprehensive picture of the entire transcriptome/targetome in lytically infected cells, we determined changes in cellular miRNA levels in both total RNA and RISC RNA as well, and bioinformatical analysis of mRNAs of total RNA/RISC fractions revealed a general, genome-wide trend toward detargeting of cellular mRNAs upon infection. Lastly, we identified the direct targets of both single strands of a VA RNAI-derived mivaRNA that constituted one of the two most abundant isoforms in RISCs of lytically infected A549 cells.

Importance: Viral and cellular miRNAs have been recognized as important players in virus-host interactions. This work provides the currently most comprehensive picture of the entire mRNA/miRNA transcriptome and of the complete RISC targetome during lytic adenovirus infection and thus represents the basis for a deeper understanding of the interplay between the virus and the cellular RNA interference machinery. Our data suggest that, at least in the model system that was employed, lytic infection by Ad5 is accompanied by a measurable global net detargeting effect on cellular mRNAs, and analysis of RISC-associated viral small RNAs revealed that the VA RNAs are the only source of virus-encoded miRNAs. Moreover, this work allows to assess the power of individual viral miRNAs to regulate cellular gene expression and provides a list of proven and putative direct targets of these miRNAs, which is of importance, given the fact that information about validated targets of adenovirus-encoded miRNAs is scarce.


Figures

FIG 1
FIG 1
Validation of the RIP-Chip protocol used for identifying mivaRNA targets. (A) Drawing of Ad5 VA RNAs I and II. (B) Schematic illustration of the test system: A549 cells were cotransduced with an adenoviral vector bearing humanized Renilla luciferase (hRLuc) and firefly luciferase (hFLuc) genes (Ad-Luc-as) and a second adenoviral vector carrying the sequence for an artificial miRNA (amiRNA) known to directly target the 3′-UTR of the hRLuc mRNA (Ad-FLuc-mi1). A distinct vector carrying the sequence for a nontargeting amiRNA (Ad-mi−) was used as a control. At 24 h postransduction, cells were lysed and RISC complexes were isolated by IP using the antibody that recognizes human AGO1 to -4. A distinct IgG isotype control antibody was used as a reference. Total RNA was isolated from 5% of the input fraction and from the IP fraction. (C) hRLuc mRNA levels are lower in the input fraction of cells expressing the targeting amiRNA (mi+) than in the input fractions of cells expressing the negative-control amiRNA (mi−). hRLuc mRNA levels at 24 h posttransduction were determined using RT-qPCR and normalized to hFLuc mRNA levels. Relative hRLuc mRNA levels (means ± standard deviations [SD], n = 3) of a representative experiment are shown. ***, P < 0.01. (D) Immunoblot analysis of the input and AGO IP fractions demonstrating the specific enrichment of AGO proteins in the IP fraction. An anti-GAPDH antibody served as a control. (E) Left panel, hRLuc mRNA is enriched in the AGO IP fractions (white bars) compared to the IgG control IP fractions (black bars) of cells expressing the hRLuc-targeting amiRNA. hRLuc mRNA levels were determined using RT-qPCR and normalized to hRLuc levels of the input fractions. GAPDH mRNA levels from the same fractions were determined as a control. Right panel, same setup as for the left panel, except that cells expressing the negative-control amiRNA were used. The data represent the mean results for 2 IP replicates of a representative experiment. (F) Endogenous hsa-miR-16 is enriched in the AGO IP fractions. Relative hsa-miR-16 levels of the AGO IP fractions, the IgG control IP fractions, and the input fractions were determined using RT-qPCR. The values for the input fraction were set as 1. Data represent the mean results for 2 IP replicates of a representative experiment. (G) Endogenous CCNE1 mRNA is enriched in the AGO IP fractions. Relative CCNE1 mRNA levels of the AGO IP fractions, the IgG control IP fractions, and the input fractions were determined using RT-qPCR. Relative CCNE1 mRNA levels of the IP fractions were calculated by normalizing against both the respective input levels and GAPDH levels. Data represent the mean results for 2 IP replicates of a representative experiment.
FIG 2
FIG 2
Relative abundance of cellular miRNAs and adenoviral sRNAs derived from VA RNAI and -II in RISCs of Ad5-infected cells. A549 cells were infected with Ad5 at an MOI of 10 TCID50/cell or were mock infected. At 30 h postinfection, AGO-containing complexes and associated RNAs were isolated by IP. RNAs from input and IP fractions were purified, 4 corresponding sRNA libraries were generated from 2 IPs, and the content of the libraries was subjected to RNA sequencing. Reads were assigned to individual sRNA annotation classes and mapped to the Ad5 genome. (A) Reads along the Ad5 genome. Left panel, input fraction. Right panel, IP fraction. The results of a single IP experiment are shown. VA RNA-derived sRNAs are indicated with arrows. (B) Relative abundance of sRNAs derived from VA RNAs I and II. Upper charts, relative abundance in the input fractions. Lower charts, relative abundance in the IP fractions. Left, abundance of all VA RNAI- and VA RNAII-derived sRNAs relative to cellular miRNAs. Middle, relative abundance of individual mivaRNA isoforms among the most prevalent isoforms derived from VA RNAI. Right, relative abundance of individual mivaRNA isoforms among the most prevalent isoforms derived from VA RNAII. Mean values from 2 IPs are shown. (C) Reads along the VA RNAI and -II regions. For consistency, coordinates based on the previous numbering of VA RNAs in which the 5′ end of 5′mivaRNAI-G represents the position +1 and the 5′ end of 5′mivaRNAI-A represents the position −3 of VA RNAI are shown. Parts representing the stem regions that give rise to RISC-incorporated mivaRNAs are indicated. Mean values from 2 IPs are shown. (D) Detailed read counts for major mivaRNA isoforms derived from the VA RNA I and II terminal stem regions that were obtained for the input (left panel) and IP (right panel) fractions. Read counts for the entire pool of cellular miRNAs, rRNA, Y RNA, 7SK RNA, and snRNA are given as a reference. Mean values from 2 IPs are shown.
FIG 3
FIG 3
Functional characterization of mivaRNA mimics. (A) HEK293 cells were cotransfected with the dual-luciferase reporter vectors pmiVAI5, pmiVAI3, and pmiVAII3 carrying sequences complementary to the mivaRNAI strands derived from the VA RNAI 5′- and 3′-arms and the 3′-arm of VA RNAII, respectively, and mimics of mivaRNAI(A)-137 or mivaRNAI(G)-137 or a nontargeting, negative-control siRNA. Luciferase activities were determined at 24 h posttransfection. Renilla luciferase activities normalized to firefly luciferase activities (means ± SD, n = 3) from a representative experiment are shown. **, P < 0.01; ***, P < 0.001; n.s., not significant. (B) The experimental setup was as described for panel A, except that cells were cotransfected with vector pAdVAntage instead of mivaRNA mimics. The parental reporter vector psiCHECK-2 lacking the mivaRNA target sites in the 3′-UTR of the Renilla luciferase mRNA was used as a control. Renilla luciferase activities normalized to firefly luciferase activities (means ± SD, n = 3) from a representative experiment are shown. ***, P < 0.001. (C) The experimental setup was as described for panel A, except that cells were not cotransfected with mivaRNA mimics or pAdVAntage but were instead infected with wild-type Ad5 at an MOI of 10 or were mock infected. Luciferase activities were determined at 24 h postinfection. Renilla luciferase activities normalized to firefly luciferase activities (means ± SD, n = 3) from a representative experiment are shown. ***, P < 0.001; n.s., not significant.
FIG 4
FIG 4
Sequences of VA RNAI variants and consequences of mivaRNA transfection on RNAs in the total RNA and RISC-associated RNA fractions. (A) VA RNAI variants VA RNAI(A) and VA RNAI(G). The mivaRNAs whose functions were analyzed in this study, mivaRNAI(A)-137 and mivaRNAI(G)-137, are indicated as red bars. The respective seed sequences of the 4 potential guide strands are indicated in color. Note that the single strands derived from the 3′-arm of the VA RNA contain identical seed sequences. The Dicer processing sites are indicated with arrows. (B and C) A549 cells were transfected with mimics of mivaRNAI(A)-137 or mivaRNAI(G)-137 or with a negative-control siRNA. AGO-containing complexes were isolated by IP at 24 h posttransfection. RNA was purified from total RNA fractions (input) and IP fractions and subjected to microarray analysis. Statistically significantly differing mRNAs are indicated as small orange dots (P < 0.05) or as larger red dots (P < 0.01). The names of genes that were eventually selected for further analysis are given in red. (B) Differences in total RNA levels (input) of A549 cells transfected with mivaRNAI(A) versus negative-control siRNA {y axis; shown as log2 [input mivaRNAI(A) − input neg.ctrl. siRNA]} and of cells transfected with mivaRNAI(G) versus negative-control siRNA {x axis; shown as log2 [input mivaRNAI(G) − input neg.ctrl. siRNA]}. RNA was isolated at 24 h posttransfection. The data represent the mean log2 changes in RNA levels in the input fractions of 3 independent IPs. (C) Differences in RNA levels in the AGO IP fractions of the same cells as in panel A that were transfected with mivaRNAI(A) versus negative-control siRNA {y axis; shown as log2 [IP mivaRNAI(A) − IP neg.ctrl. siRNA]} and of cells transfected with mivaRNAI(G) versus negative-control siRNA {x axis; shown as log2 [IP mivaRNAI(G) − IP neg.ctrl. siRNA]}. All mRNA levels in the IP fractions were corrected for their respective levels in the total RNA fraction (input). Mean log2 enrichments from 3 independent IPs are shown.
FIG 5
FIG 5
Predicted mivaRNAI targets are overrepresented in AGO IP fractions of mivaRNA-transfected cells. TargetScan was used to predict the cellular targets of the individual single strands of mivaRNAI(G)-137 and mivaRNAI(A)-137, respectively. We used hypergeometric testing to investigate the overrepresentation of RNAs with matches to mivaRNA-137 seed sequences within the top 25 and top 50 RNAs most highly enriched in RISCs (after normalizing to input RNA levels) of cells transfected with mivaRNAI(G)-137 and mivaRNAI(A) compared to RISCs of cells transfected with the negative-control siRNA. As a control, we also tested RNAs with seed sequence matches to VA RNAI 3′-arm-derived single strands of mivaRNAI-134 to -141 and mivaRNAII-136 to -140 derived from the 3′-arm of VA RNAII. y axis, P values (−log10) representing the grade of overrepresentation of RNAs with seed sequence matches to the individual mivaRNAs within the sets of RNAs enriched in RISCs compared to the entire set of RNAs. The yellow line represents a P value of 0.05; the red line, a P value of 0.001. Sequences of mivaRNAs derived from the 5′-and 3′-arms of the respective VA RNAs are indicated as 5′ and 3′, respectively. (A) Overrepresentation of RNAs with seed matches to the individual mivaRNA single strands in RISCs of cells transfected with mivaRNAI(G)-137. (B) Overrepresentation of RNAs with seed matches to the individual mivaRNA single strands in RISCs of cells transfected with mivaRNAI(A)-137 in a purged list of RNAs lacking the top 1,000 genes that were enriched by both mivaRNAI(G)-137 and mivaRNAI(A)-137. (C) Analysis as in panel B with the difference that a purged list lacking RNAs that were exclusively enriched by mivaRNAI(A)-137 was used.
FIG 6
FIG 6
Changes in gene expression and incorporation of RNAs in RISCs upon infection of cells with Ad5. (A) A549 cells were infected with Ad5 at an MOI of 10. AGO-containing complexes were isolated using IP at 30 h postinfection. RNA was purified from total RNA fractions (input) and IP fractions and subjected to microarray analysis. Differences in RNA levels in the AGO IP fractions of cells infected with wild-type Ad5 versus mock-infected cells (y axis; shown as log2 [IP Ad5 − IP mock]), and the differences in total RNA levels (input fraction) of the same cells (x axis; shown as log2 [input Ad5 − input mock]) were calculated. The data represent the mean log2 changes in RNA levels of 2 independent IPs. Statistically significantly altered RNAs (P < 0.01; red dots) and the names of genes that were finally selected for further analysis are indicated. (B and C) Correlation of enrichment of RNAs in RISCs of mivaRNA-transfected cells with the enrichment of RNAs in RISCs of cells infected with Ad5. The scatter plots show the distribution of the top 20 (large red circles), top 50 (medium red circles), and top 100 (small orange circles) RNAs with the highest log2-fold changes in IP (normalized to input) of cells transfected with mivaRNA mimics versus cells transfected with a negative-control siRNA within the pool of RNAs that became up-/downregulated and enriched/depleted upon Ad5 infection, respectively. (B) RNAs enriched upon mivaRNAI(A)-137 transfection highlighted. (C) RNAs enriched upon mivaRNAI(G)-137 transfection highlighted.
FIG 7
FIG 7
RT-qPCR-based calculation of the enrichment of selected candidate target RNAs in RISCs of cells transfected with mivaRNAI(A)-137 or mivaRNAI(G)-137 compared to RISCs of cells transfected with a negative-control siRNA (A) and enrichment of RNAs in RISCs of Ad5-infected cells compared to RISCs of mock-infected cells (B). Total RNA of AGO IP fractions were subjected to RT-qPCR using the respective gene-specific primer pairs, and individual RNA levels were normalized to GAPDH RNA levels. Mean enrichment levels ± SD in the RISC fractions are shown. *, P < 0.05; **, P < 0.01; ***, P < 0.001.
FIG 8
FIG 8
Changes in the expression of selected candidate target genes upon transfection with mivaRNAs. A549 cells were transfected with mimics of mivaRNAI(A)-137 and mivaRNAI(G)-137 or with a negative-control siRNA. Putative target gene mRNA levels at 48 h posttransfection normalized to GAPDH mRNA levels were determined by RT-qPCR using the respective primer pairs. Relative mRNA levels (means ± SD from 2 independent experiments, each performed in triplicate) of cells transfected with mivaRNA mimics in comparison to cells transfected with a negative-control siRNA are shown. *, P < 0.05; **, P < 0.01; ***, P < 0.001.
FIG 9
FIG 9
Effects of mivaRNA mimics on the expression of luciferase reporter genes. HEK293 cells were transfected with reporter constructs carrying the predicted mivaRNAI(A)-137 and mivaRNAI(G)-137 target regions as part of the 3′-UTR of a Renilla luciferase gene. The parental vector psiCHECK-2 lacking those sequences served as a negative control. Concomitantly, cells were transfected with mimics of mivaRNAI(A)-137 or mivaRNAI(G)-137 or with a negative-control siRNA. Renilla luciferase activities were normalized to firefly luciferase activities determined at 48 h posttransfection; the 2 luciferases were encoded by their respective reporter gene located on the same vectors. Relative light units (means ± SD; n = 3) in comparison to the negative-control siRNA are shown. ***, P < 0.001.
FIG 10
FIG 10
Overrepresentation of RNAs with seed sequence matches to VA RNAI- and VA RNAII-derived mivaRNAs among RNAs enriched in RISCs of Ad5-infected cells. Hypergeometric testing was performed to calculate significant overrepresentation of RNAs that were predicted by TargetScan to be targeted by a set of mivaRNA isoforms among the top 500, 1,000, 2,000, and 3,000 RNAs most highly enriched in RISCs of Ad5-infected cells compared to mock-infected cells. We tested RNAs with seed sequence matches to VA RNAI 5′-arm-derived single strands of mivaRNAI(G)-137 and mivaRNAI(A)-137, to VA RNAI 3′-arm-derived single strands of mivaRNAI-134, -135, -136, -137, -138, -139, -140, and -141, and to VA RNAII 3′-arm-derived mivaRNAII-136, -137, -138, -139, and -140. y axis, P values (−log10) representing the grade of overrepresentation of RNAs with seed sequence matches to the individual mivaRNAs within the sets of RNAs enriched in RISCs compared to the entire set of RNAs. The yellow line represents a P value of 0.05; the red line, a P value of 0.001.
FIG 11
FIG 11
(A) Compared to the rest of the experimentally validated targets of cellular miRNAs, those targets whose levels increase upon Ad5 infection and that are concurrently depleted in RISCs are more frequently targeted by miRNAs whose levels decrease upon Ad5 infection. The scatter plots depict changes in mRNA levels in total RNA (x axis) and RISC IP fractions (y axis) upon infection with Ad5. Dots in the lower right quadrants represent mRNAs whose levels increase upon Ad5 infection and that are concurrently depleted in RISCs. Red dots indicate mRNAs with RISC enrichment levels relative to input that fall below a certain threshold (first panel, log2-fold change = 0; second panel, log2-fold change = −1; third panel, log2-fold change = −2; fourth panel, log2-fold change = −3). The numbers in the lower right corners indicate the percentages of these genes that are proven targets of miRNAs that were found to be depleted (log2 FC < −0.7) in RISCs of Ad5-infected cells (normalized to input) compared to uninfected cells. This percentage is increasing from left to right, indicating that mRNAs that are more highly depleted in RISCs represent to a higher extent targets of miRNAs that are downregulated upon Ad5 infection. For comparison, the markedly lower percentage of the rest of mRNAs that are validated targets of miRNAs depleted in RISCs of Ad5-infected cells (log2 FC < −0.7) is indicated in the upper left corner of the plots. (B) Sylamer enrichment landscape plot for 6-mer motifs. The x axis represents the list of RNAs (3′-UTRs) sorted from most enriched (left) to most depleted (right) in RISCs relative to input of Ad5-infected A549 cells versus mock-infected cells. The y axis shows the hypergeometric enrichment of 6-mer sequences along the sorted-gene list. Positive values indicate enrichment and negative values depletion. The sequences of the 10 most highly enriched and depleted 6-mer motifs in the data set are shown above and below the plot, respectively. The motif corresponding to the let-7 seed-complementary sequence and the corresponding enrichment P values along the sorted-gene list are shown in color.

Similar articles

Cited by

References

    1. Bartel DP. 2009. MicroRNAs: target recognition and regulatory functions. Cell 136:215–233. doi:10.1016/j.cell.2009.01.002. - DOI - PMC - PubMed
    1. Huntzinger E, Izaurralde E. 2011. Gene silencing by microRNAs: contributions of translational repression and mRNA decay. Nat Rev Genet 12:99–110. doi:10.1038/nrg2936. - DOI - PubMed
    1. Kincaid RP, Sullivan CS. 2012. Virus-encoded microRNAs: an overview and a look to the future. PLoS Pathog 8:e1003018. doi:10.1371/journal.ppat.1003018. - DOI - PMC - PubMed
    1. Boss IW, Renne R. 2011. Viral miRNAs and immune evasion. Biochim Biophys Acta 1809:708–714. doi:10.1016/j.bbagrm.2011.06.012. - DOI - PMC - PubMed
    1. Ghosh Z, Mallick B, Chakrabarti J. 2009. Cellular versus viral microRNAs in host-virus interaction. Nucleic Acids Res 37:1035–1048. - PMC - PubMed

Publication types