Knockout of nuclear high molecular weight FGF2 isoforms in mice modulates bone and phosphate homeostasis
- PMID: 25389287
- PMCID: PMC4276890
- DOI: 10.1074/jbc.M114.619569
Knockout of nuclear high molecular weight FGF2 isoforms in mice modulates bone and phosphate homeostasis
Abstract
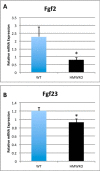
We previously reported that targeted overexpression of the fibroblast growth factor 2 (FGF2) high molecular weight (HMW) isoforms in osteoblastic lineage cells in mice resulted in phenotypic changes, including dwarfism, rickets, osteomalacia, hypophosphatemia, increased serum parathyroid hormone, and increased levels of the phosphatonin FGF23 in serum and bone. This study examined the effects of genetically knocking out the FGF2HMW isoforms (HMWKO) on bone and phosphate homeostasis. HMWKO mice were not dwarfed and had significantly increased bone mineral density and bone mineral content in femurs and lumbar vertebrae when compared with the wild-type (WT) littermates. Micro-computed tomography analysis of femurs revealed increased trabecular bone volume, thickness, number, and connective tissue density with decreased trabecular spacing compared with WT. In addition, there was significantly decreased cortical porosity and increased cortical thickness and sub-periosteal area in femurs of HMWKO. Histomorphometric analysis demonstrated increased osteoblast activity and diminished osteoclast activity in the HMWKO. In vitro bone marrow stromal cell cultures showed there was a significant increase in alkaline phosphatase-positive colony number at 1 week in HMWKO. At 3 weeks of culture, the mineralized area was also significantly increased. There was increased expression of osteoblast differentiation marker genes and reduced expression of genes associated with impaired mineralization, including a significant reduction in Fgf23 and Sost mRNA. Normal serum phosphate and parathyroid hormone were observed in HMWKO mice. This study demonstrates a significant negative impact of HMWFGF2 on biological functions in bone and phosphate homeostasis in mice.
Keywords: Bone; Fibroblast Growth Factor (FGF); RNA; Transcription Regulation; Wnt Signaling.
© 2014 by The American Society for Biochemistry and Molecular Biology, Inc.
Figures


Similar articles
-
FGF23 Neutralizing Antibody Partially Improves Bone Mineralization Defect of HMWFGF2 Isoforms in Transgenic Female Mice.J Bone Miner Res. 2018 Jul;33(7):1347-1361. doi: 10.1002/jbmr.3417. Epub 2018 Apr 10. J Bone Miner Res. 2018. PMID: 29502359 Free PMC article.
-
Nuclear fibroblast growth factor 2 (FGF2) isoforms inhibit bone marrow stromal cell mineralization through FGF23/FGFR/MAPK in vitro.J Bone Miner Res. 2013 Jan;28(1):35-45. doi: 10.1002/jbmr.1721. J Bone Miner Res. 2013. PMID: 22836867 Free PMC article.
-
Inhibition of FGFR Signaling Partially Rescues Hypophosphatemic Rickets in HMWFGF2 Tg Male Mice.Endocrinology. 2017 Oct 1;158(10):3629-3646. doi: 10.1210/en.2016-1617. Endocrinology. 2017. PMID: 28938491 Free PMC article.
-
Emerging role of fibroblast growth factor 23 in a bone-kidney axis regulating systemic phosphate homeostasis and extracellular matrix mineralization.Curr Opin Nephrol Hypertens. 2007 Jul;16(4):329-35. doi: 10.1097/MNH.0b013e3281ca6ffd. Curr Opin Nephrol Hypertens. 2007. PMID: 17565275 Review.
-
Cellular and molecular effects of growth hormone and estrogen on human bone cells.APMIS Suppl. 1997;71:1-30. APMIS Suppl. 1997. PMID: 9357492 Review.
Cited by
-
Fibroblast growth factor signaling in skeletal development and disease.Genes Dev. 2015 Jul 15;29(14):1463-86. doi: 10.1101/gad.266551.115. Genes Dev. 2015. PMID: 26220993 Free PMC article. Review.
-
Ablation of low-molecular-weight FGF2 isoform accelerates murine osteoarthritis while loss of high-molecular-weight FGF2 isoforms offers protection.J Cell Physiol. 2019 Apr;234(4):4418-4431. doi: 10.1002/jcp.27230. Epub 2018 Aug 25. J Cell Physiol. 2019. PMID: 30144364 Free PMC article.
-
Role of Basic Fibroblast Growth Factor in Cancer: Biological Activity, Targeted Therapies, and Prognostic Value.Cells. 2023 Mar 24;12(7):1002. doi: 10.3390/cells12071002. Cells. 2023. PMID: 37048074 Free PMC article. Review.
-
Fibroblast Growth Factor 2 and Its Receptors in Bone Biology and Disease.J Endocr Soc. 2018 May 28;2(7):657-671. doi: 10.1210/js.2018-00105. eCollection 2018 Jul 1. J Endocr Soc. 2018. PMID: 29942929 Free PMC article. Review.
-
Periostin gene expression in neu-positive breast cancer cells is regulated by a FGFR signaling cross talk with TGFβ/PI3K/AKT pathways.Breast Cancer Res. 2021 Nov 22;23(1):107. doi: 10.1186/s13058-021-01487-8. Breast Cancer Res. 2021. PMID: 34809697 Free PMC article.
References
-
- Gospodarowicz D. (1990) Fibroblast growth factor. Chemical structure and biologic function. Clin. Orthop. Relat. Res. 257, 231–248 - PubMed
-
- Okada-Ban M., Thiery J. P., Jouanneau J. (2000) Fibroblast growth factor-2. Int. J. Biochem. Cell. Biol. 32, 263–267 - PubMed
-
- Sørensen V., Nilsen T., Wiedłocha A. (2006) Functional diversity of FGF-2 isoforms by intracellular sorting. BioEssays 28, 504–514 - PubMed
Publication types
MeSH terms
Substances
Grants and funding
LinkOut - more resources
Full Text Sources
Other Literature Sources
Molecular Biology Databases

