. 2014 Dec 15;193(12):6192-206.
doi: 10.4049/jimmunol.1400859. Epub 2014 Nov 7.

NK cells with KIR2DS2 immunogenotype have a functional activation advantage to efficiently kill glioblastoma and prolong animal survival

Affiliations

NK cells with KIR2DS2 immunogenotype have a functional activation advantage to efficiently kill glioblastoma and prolong animal survival

Andrea Gras Navarro et al. J Immunol. .

Abstract

Glioblastomas (GBMs) are lethal brain cancers that are resistant to current therapies. We investigated the cytotoxicity of human allogeneic NK cells against patient-derived GBM in vitro and in vivo, as well as mechanisms mediating their efficacy. We demonstrate that KIR2DS2 immunogenotype NK cells were more potent killers, notwithstanding the absence of inhibitory killer Ig-like receptor (KIR)-HLA ligand mismatch. FACS-sorted and enriched KIR2DS2(+) NK cell subpopulations retained significantly high levels of CD69 and CD16 when in contact with GBM cells at a 1:1 ratio and highly expressed CD107a and secreted more soluble CD137 and granzyme A. In contrast, KIR2DS2(-) immunogenotype donor NK cells were less cytotoxic against GBM and K562, and, similar to FACS-sorted or gated KIR2DS2(-) NK cells, significantly diminished CD16, CD107a, granzyme A, and CD69 when in contact with GBM cells. Furthermore, NK cell-mediated GBM killing in vitro depended upon the expression of ligands for the activating receptor NKG2D and was partially abrogated by Ab blockade. Treatment of GBM xenografts in NOD/SCID mice with NK cells from a KIR2DS2(+) donor lacking inhibitory KIR-HLA ligand mismatch significantly prolonged the median survival to 163 d compared with vehicle controls (log-rank test, p = 0.0001), in contrast to 117.5 d (log-rank test, p = 0.0005) for NK cells with several inhibitory KIR-HLA ligand mismatches but lacking KIR2DS2 genotype. Significantly more CD56(+)CD16(+) NK cells from a KIR2DS2(+) donor survived in nontumor-bearing brains 3 wk after infusion compared with KIR2DS2(-) NK cells, independent of their proliferative capacity. In conclusion, KIR2DS2 identifies potent alloreactive NK cells against GBM that are mediated by commensurate, but dominant, activating signals.


Figures

FIGURE 1.
FIGURE 1.
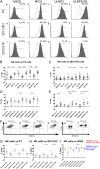
Ligation of NKG2D to stress-induced ligands and the activating KIR2DS2 receptor are important for efficient NK cell–mediated cytotoxicity of GBM cells. (A) Surface expression of ligands for NKG2D receptors MICB, MICA, ULBP3, and ULBP 2/5/6 on P3 (Aa–Ad), 2011-20-I (Ae–Ah), and 2012-018 (Ai–Al) cells. Dashed graphs represent negative controls; filled graphs represent staining. The proportion of specifically stained cells indicated was calculated by subtracting the percentage of isotype-control–positive cells from the percentage of marker-positive cells. The percentage lysis by NK cells of P3 (B) and 2012-018 (C) GBM cells at E:T ratios of 5:1, 10:1, and 20:1, with and without addition of blocking NKG2D or IgG1 isotype-control Abs. Mean percentage (± SEM) of lysis of P3 (D) and 2012-018 (E) GBM cells mediated by KIR2DS2+ or KIR2DS4+ NK cells compared with NK cells lacking both receptors (negative) at E:T ratios of 5:1, 10:1, and 20:1. Data are mean ± SEM of three or four independent experiments/donor (n = 6 donors). The x-axis shows experimental condition and E:T ratio (in parentheses). *p < 0.05, **p = 0.01, ***p < 0.001. (F) CD56 versus KIR2DS2 dot plots represent the gating strategy of KIR2DS2+ subpopulations of donors 3 (Fa), 6 (Fb), 7 (Fc), and 8 (Fd). CD56 versus KIR2DS4 dot plots represent the gating strategy for KIR2DS4+ expression on NK cell subpopulations of donors 9 (Fe) and 10 (Ff). Data are mean percentage (± SEM) of cells expressing KIR2DS2 or KIR2DS4 receptors. Mean percentage (± SEM) of lysis of P3 GBM cells (G), 2012-018 GBM cells (H), and K562 cells (I) mediated by NK cells from donors 6 and 7 (red: possessing KIR2DS2 gene and no other activating KIR genes) compared with NK cells from donors 4 and 5 (blue: lacking KIR2DS2 gene, but possessing three or more genes of other activating KIRs) at E:T ratios of 2:1, 5:1, 10:1, and 20:1. Data are mean ± SEM of three or four independent experiments/donor. *p < 0.05.
FIGURE 2.
FIGURE 2.
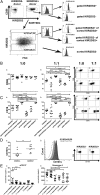
Activating KIR2DS2 receptor contributes to a functional advantage for NK cells. (A) Gating strategy of KIR2DS2 subpopulations from NK cell donors. (Aa) CD56 versus KIR2DS2 dot plot showing NK cell gating of KIR2DS2 donors. (Ab) CD56 versus KIR2DS2 dot plot showing NK cell gating of KIR2DS2+ donors. KIR2DS2 and KIR2DS2+ subpopulations are gated. (Ac) KIR2DS2 graph of the KIR2DS2+ donors. KIR2DS2 and KIR2DS2+ subpopulations are gated. (Ad) KIR2DS2 graph of the KIR2DS2+ gated subpopulation of KIR2DS2+ donors. (Ae) KIR2DS2 graph of the KIR2DS2 gated subpopulation of KIR2DS2+ donors. (Af) KIR2DS2 versus FSC dot plot representative of the KIR2DS2+ and KIR2DS2 sorting procedure of KIR2DS2+ donors. KIR2DS2 and KIR2DS2+ subpopulations are gated. Data are mean percentage (± SEM) of cells. (Ag) KIR2DS2 graph of KIR2DS2+ sorted cells, obtained after 2 wk in culture following the initial sorting. KIR2DS2 and KIR2DS2+ subpopulations are gated. (Ah) KIR2DS2 graph of KIR2DS2+ gated subpopulation of KIR2DS2+ sorted cells. (Ai) KIR2DS2 graph of KIR2DS2 gated subpopulation of KIR2DS2+ sorted cells. (Aj) KIR2DS2 graph of KIR2DS2 sorted cells, obtained after 2 wk in culture following the initial sorting. Data are mean percentage (± SEM) of cells. Dashed histograms represent negative control (immunogenotype KIR2DS2 donor stained for KIR2DS2) and filled black histograms represent gated or sorted population stained for KIR2DS2. (B) Percentage of cells from each of the subpopulation described above expressing the CD69 surface receptor when cultured as monoculture 1:0 (Ba) or cocultured with P3 GBM (1:1) (Bb). Dot plots of CD56 versus CD69 for gated KIR2DS2+ (Bc and Bd) and gated KIR2DS2 (Be and Bf) subpopulations when cultured as monoculture 1:0 or cocultured with P3 (1:1). (C) Percentage of cells of each subpopulation described above expressing the CD16 surface receptor when cultured as monoculture 1:0 (Ca) or cocultured with P3 (1:1) (Cb). Dot plots of CD56 versus CD16 of the gated KIR2DS2+ (Cc and Cd) and gated KIR2DS2 (e and f) subpopulations when cultured as monoculture 1:0 or cocultured with P3 (1:1). (Da) Percentage of cells of the KIR2DS2 and KIR2DS2+ donors expressing the CD107a surface receptor. (Db) Representative CD107a graph of KIR2DS2 donors (filled gray), KIR2DS2+ donors (filled black), and negative controls (dashed line). Data are mean percentage (± SEM) of positive cells. Dot plots of CD56 versus CD107a of the KIR2DS2 (Dc) and KIR2DS2+ (Dd) donors. (E) Concentration (pg/ml) of sCD137 (Ea) and granzyme A (Eb) in the supernatant of cultures of different subpopulations of NK cells in monocultures 1:0 or in cocultures with P3 (1:1) for 4 h in serum-free RPMI 1640 without cytokine supplement. Data are mean ± SEM of three or four independent experiments/donor. *p < 0.05, **p < 0.01, ***p < 0.001, ****p < 0.0001.
FIGURE 3.
FIGURE 3.
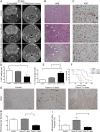
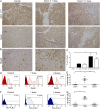
Treatment with a single dose of NK cells significantly increases animal survival. (A) T2-weighted and postcontrast T1-weighted images of NOD/SCID mice bearing P3 tumors treated with one dose of NK cells from donor 4 or donor 3 or controls. Tumors are indicated by arrowheads. (B) H&E staining of tumors treated with donor 3–derived or donor 4–derived NK cells. Necrosis is indicated by arrowheads (scale bar, 100 μm; original magnification ×200). (C) Ki-67+ cells (scale bar, 100 μm; original magnification ×400). Percentage Ki-67–positive (D) and cell death as represented by the percentage of TUNEL+ apoptotic/necrotic cells (E). Data are mean ± SEM. (F) Kaplan–Meier survival curves of animals treated with vehicle PBS/CD2 and NKp46 Abs (n = 10 animals) or with one or two doses of NK cells from donor 4 or donor 3 (n = 7 animals/group). (G) CD31 immunostaining from control mouse and mice that received one dose of NK cells from donor 4 or donor 3 (scale bar, 100 μm; original magnification ×200). Microvascular density (H) and percentage of area positive for CD31 microvessels (I). *p < 0.05, ***p < 0.001.
FIGURE 4.
FIGURE 4.
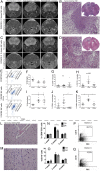
Increased proinflammatory macrophages/microglia within the tumor after one-dose NK cell treatment. (A) Longitudinal T2-weighted (upper panels) and postcontrast T1-weighted (lower panels) images of NOD/SCID mice bearing P3 tumors before (12 d) and after treatment with one or two doses (19 and 26 d, respectively) of NK cells from donor 4. (B) H&E staining of tumor-bearing mouse brain after two doses of donor 3 NK cells. Immune infiltrates in the contralateral hemisphere region as indicated by the white box in (A) (scale bar, 100 μm; original magnification ×200). Inset shows a whole-brain histological section stained with H&E from the white box region on MR images from a representative animal treated with donor 4–derived NK cells. (C) Longitudinal T2-weighted (upper panels) and postcontrast T1-weighted (lower panels) images of NOD/SCID mice bearing P3 tumors before (12 d) and after treatment with one or two doses (19 and 26 d, respectively) of NK cells from donor 3. (D) H&E staining of tumor-bearing mouse brain after two doses of donor 4 NK cells. Immune infiltrates in the contralateral hemisphere region as indicated by the white box in (C) (scale bar, 100 μm; original magnification ×200). Inset shows a whole-brain histological section stained with H&E from the white box region on MR images from a representative animal treated with donor 3–derived NK cells. (E) Representative examples of flow cytometry gating of microglia (CD45lowCD11b+) and macrophage (CD45highCD11b+) populations of the control group (top panel) and the groups that received one dose (middle panel) or two doses (bottom panel) of NK cells. (F) Proportions of microglia within all immune (CD45+) cells as evaluated by flow cytometry. Data are mean ± SEM (n = 6/group). Proportions of microglia expressing CD40 (G) or CD127 (H), as evaluated by flow cytometry. Data are mean ± SEM (n = 6/group). (I) Proportions of macrophages within all immune (CD45+) cells, as evaluated by flow cytometry. Data are mean ± SEM (n = 6/group). Proportions of macrophages expressing CD40 (J) or F4/80 (K), as evaluated by flow cytometry. Data are mean ± SEM (n = 6/group). Histological H&E staining of nontumor-bearing mouse brain after two doses of donor 4 NK cells (L) or two doses of donor 3 NK cells (M) (scale bar, 10 μm; original magnification ×400). Percentage of donor 3 and donor 4 NK cells (CD56+ and CD3) (N) and CD16+ NK cells (O) in nontumor–bearing mouse brains 1, 3, and 5 wk after NK cell treatment. Dot plots of CD16 versus FSC showing the percentage of CD16+ cells present 3 wk after donor 3 (P) or donor 4 (Q) NK cell treatment. *p < 0.05.
FIGURE 5.
FIGURE 5.
Single-dose NK cell treatment induces nestin, HLA-A, HLA-B, and HLA-C expression on tumor cells. (A) Human-specific STEM121+ cells in P3 tumor-bearing mice treated with vehicle controls or one dose of NK cells from donor 4 or donor 3 (scale bar, 100 μm; original magnification ×200). Nestin expression by IHC in tumors treated with one dose of NK cells from donor 4 or donor 3 compared with controls post mortem (scale bar, 100 μm; original magnification ×200). White arrowheads in (A) indicate regions of necrotic tumor tissue. (B) Human-specific NKp46 staining demonstrates infiltration of the injected NK cells into the tumor in vivo (right panel) and staining of human tonsil used as a positive control (left panel) (scale bar, 10 μm; original magnification ×400). (C) Percentage of NKp46+ cells (mean ± SEM) in tumor tissue. (D) Representative graphs showing nestin expression on tumor cells from control animals and animals treated with one or two doses of NK cells, as evaluated by flow cytometry. The gate represents the “nestinbright” population within all tumor (nestin+) cells (red: negative control; pink: nestin). (E) Proportion of nestinbright population within all tumor (nestin+) cells, as evaluated by flow cytometry. Data are mean ± SEM (n = 6/group). (F) Representative graphs showing HLA-A,B,C expression on tumor cells from control animals and animals treated with one or two doses of NK cells, as evaluated by flow cytometry. The gate represents the HLA-A,B,C+ population within all tumor (nestin+) cells (blue: isotype control; pale blue: HLA-A,B,C). (G) Proportions of HLA-A,B,C+ population within all tumor (nestin+) cells, as evaluated by flow cytometry. Data are mean ± SEM (n = 6/group). *p < 0.05, **p < 0.01.

Similar articles

Cited by

References

    1. Louis D. N., Ohgaki H., Wiestler O. D., Cavenee W. K., Burger P. C., Jouvet A., Scheithauer B. W., Kleihues P. 2007. The 2007 WHO classification of tumours of the central nervous system. Acta Neuropathol. 114: 97–109. - PMC - PubMed
    1. Stupp R., Mason W. P., van den Bent M. J., Weller M., Fisher B., Taphoorn M. J., Belanger K., Brandes A. A., Marosi C., Bogdahn U., et al. European Organisation for Research and Treatment of Cancer Brain Tumor and Radiotherapy Groups.; National Cancer Institute of Canada Clinical Trials Group 2005. Radiotherapy plus concomitant and adjuvant temozolomide for glioblastoma. N. Engl. J. Med. 352: 987–996. - PubMed
    1. Ishikawa E., Takano S., Ohno T., Tsuboi K. 2012. Adoptive cell transfer therapy for malignant gliomas. Adv. Exp. Med. Biol. 746: 109–120. - PubMed
    1. Ishikawa E., Tsuboi K., Takano S., Uchimura E., Nose T., Ohno T. 2004. Intratumoral injection of IL-2-activated NK cells enhances the antitumor effect of intradermally injected paraformaldehyde-fixed tumor vaccine in a rat intracranial brain tumor model. Cancer Sci. 95: 98–103. - PMC - PubMed
    1. Ghiringhelli F., Ménard C., Martin F., Zitvogel L. 2006. The role of regulatory T cells in the control of natural killer cells: relevance during tumor progression. Immunol. Rev. 214: 229–238. - PubMed

Publication types

MeSH terms