. 2015 Feb 19;518(7539):337-43.
doi: 10.1038/nature13835. Epub 2014 Oct 29.

Genetic and epigenetic fine mapping of causal autoimmune disease variants

Affiliations

Genetic and epigenetic fine mapping of causal autoimmune disease variants

Kyle Kai-How Farh et al. Nature. .

Abstract

Genome-wide association studies have identified loci underlying human diseases, but the causal nucleotide changes and mechanisms remain largely unknown. Here we developed a fine-mapping algorithm to identify candidate causal variants for 21 autoimmune diseases from genotyping data. We integrated these predictions with transcription and cis-regulatory element annotations, derived by mapping RNA and chromatin in primary immune cells, including resting and stimulated CD4(+) T-cell subsets, regulatory T cells, CD8(+) T cells, B cells, and monocytes. We find that ∼90% of causal variants are non-coding, with ∼60% mapping to immune-cell enhancers, many of which gain histone acetylation and transcribe enhancer-associated RNA upon immune stimulation. Causal variants tend to occur near binding sites for master regulators of immune differentiation and stimulus-dependent gene activation, but only 10-20% directly alter recognizable transcription factor binding motifs. Rather, most non-coding risk variants, including those that alter gene expression, affect non-canonical sequence determinants not well-explained by current gene regulatory models.


Conflict of interest statement

Conflict of Interest: B.E.B. is a scientific advisor for Syros Pharmaceuticals and a founder and scientific advisor for HiFiBio SAS.

Figures

Extended Data Figure 1
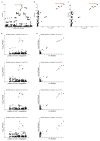
Extended Data Figure 1. GWAS Result for IBD Immunochip data at IL23R locus (actual data a–c, simulated permutationd d–e)
(a) Each of the 500 SNPs in the IL23R densely genotyped locus is plotted according to its association signal and position along the chromosome. The R381Q missense variant is circled in red. (b) Each of the 500 SNPs in the IL23R densely genotyped locus is plotted according to its association signal and r2 linkage to R381Q. (c) Same as (b), but showing the association signal on the y-axis in chi-square units. Over the range of values typically encountered in GWAS analyses, chi-square units and log p-value are asymptotically linear. (d) Simulated permutation analysis of signal at IL23R locus. 1.2-fold odds ratio signal was simulated at the R381Q SNP by fixing the association signal at R381Q, but permuting cases and controls such that all other SNPs are neutral and vary only with statistical noise. Four representative results from the simulations are shown, with the panels on the left showing the association signal in genomic space, and the panels on the right (e) showing the association signal for each SNP in relation to r2.
Extended Data Figure 2
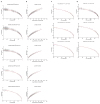
Extended Data Figure 2. Calculating the Relative Likelihood of Being the Causal SNP from Standard Deviation in Association Signal
(a) For each SNP in the IL23R locus, the mean association signal and the standard deviation, calculated across 1000 permutations (using a 1.2-fold odds ratio at the R381Q SNP), are shown in genomic space and (b) in terms of each SNP’s r2 linkage disequilibrium to the causal R381Q variant. (c) The distribution of association signals at rs77319898 (r2 = 0.71 to the causal variant) for 1000 permutations is shown. The distribution of association signal values at each SNP approximated a normal distribution. (d) PICS analysis of a two SNP case to determine the relative likelihood of each to explain the pattern of association at the locus. The SNPs represented here are R381Q (SNP A) and rs77319898 (SNP B), which has an r2 = 0.71 to R381Q. The signal at SNP B is well-explained by LD to SNP A, in a model where SNP A is treated as the putative causal variant. The error bars indicate the standard deviation in the association signal expected for SNP B, under the assumption that SNP A is causal. (e) The signal at SNP A is poorly explained by LD to SNP B, in a model where SNP B is treated as the putative causal variant. The error bars indicate the standard deviation in the association signal expected for SNP A, under the assumption that SNP B is causal.
Extended Data Figure 3
Extended Data Figure 3. Simulated Permutations and Empiric Curve Fitting for 30,000 GWAS Signals at Immunochip Loci
(a) We simulated 30,000 causal SNPs in densely mapped Immunochip regions. Plot shows the relationship between standard deviation in the association signal of neutral SNPs and their r2 to the causal SNP (neutral SNPs within r2 > 0.5 of the simulated causal variant are shown). The red line indicates the expected values derived from the empiric equation for the standard deviation of the association signal at neutral SNPs in LD with the causal SNP. (b) Plot shows the relationship between standard deviation in the association signals of neutral SNPs and the association signal of the causal SNP. Each panel represents the set of neutral SNPs with the indicated r2 to the causal variant. (c) Simulated permutations over a range of case-control ratios. We plotted the relationship between standard deviation at neutral SNPs and their r2 to the causal SNP. Plots are shown for three series of simulations, with the percentage of cases fixed at 10%, 20%, and 50% of the total sample size, and a causal SNP p-value of 10−20. Red line indicates the expected values derived from the empiric equation for the standard deviation of the association signal at neutral SNPs in LD with the causal SNP in the locus. (d) Simulated permutations over a range of effect sizes. Plots are shown for three series of simulations, with the effect size fixed at 1.2-fold, 1.5-fold, and 2.0-fold, and the corresponding lead SNP p-values fixed at 10−20, 10−70, and 10−150 respectively.
Extended Data Figure 4
Extended Data Figure 4. Comparison of PICS with prior Bayesian fine-mapping method
Bar graph shows the percentage of MS SNPs overlapping immune enhancers using different algorithms for calling candidate causal SNPs. The dotted line indicates the background rate at which random 1000 Genomes Project SNPs drawn from the same loci intersect immune enhancers (~8%). The categories shown are (from top to bottom): 257 SNPs called only by PICS, 3812 SNPs called only by the Bayesian method, 177 SNPs called by both PICS and the Bayesian method, all 434 SNPs called by PICS, 165 called by the Bayesian using a cutoff that only includes the highest confidence SNPs, and all 4070 SNPs called by Bayesian method.
Extended Data Figure 5
Extended Data Figure 5. LD Distance Between PICS lead SNPs and GWAS catalog index SNPs
Histogram indicates LD distance (in r2) between PICS fine-mapped Immunochip lead SNPs and previously reported GWAS catalog index SNPs from the same loci.
Extended Data Figure 6
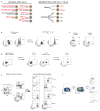
Extended Data Figure 6. Purification of Human Immune Cell Subsets
(a) Immune populations subjected to epigenomic profiling in this study (red labels) or prior publications. (b) CD4+ cells were enriched based on CD25 expression (MACS) and subsequently sorted based on CD25highCD127low/− to isolate Treg cells; confirmed with FOXP3 intracellular staining. (c) CD4+CD25 cells were sorted to isolate Tmem (CD45RO+CD45RA) and Tnaive (CD45ROCD45RA+) cells. (d) CD4+CD25− cells were PMA/ionomycin stimulated and separated based on IL17 surface expression (MACS and FACS) to isolate Th17 cells (IL17+) and ThStim cells (IL17). (e) Naïve (CD45RA+CD45RO) and memory (CD45RACD45RO+) CD8+ T cells were isolated using a BD FACSAria 4-way cell sorter. Results are shown from one of two large-scale sorts. (f) Mononuclear cells were isolated from pediatric tonsils. Following CD10 enrichment (MACS), B centroblasts (CD19+CD10+CXCR4+CD44CD3) were purified by FACS.
Extended Data Figure 7
Extended Data Figure 7. PICS SNPs Localize to Immune Enhancers and Stimulus-Dependent H3K27ac Peaks in Super-enhancers
(a) Correlation matrix of 56 cell types, clustered by similarity of H3K27ac profiles (high=red, low=blue). (b) Enrichment of noncoding autoimmune disease candidate causal SNPs within immune enhancers and promoters compared to background. The background expectation is based on frequency-matched control SNPs drawn from within 50kb of the candidate causal SNPs. Candidate causal SNPs that produced coding changes or were in LD with a coding variant (paired bars on the right) showed a smaller degree of enrichment in immune enhancers and promoters compared to background. (c) Overlap of PICS SNPs with H3K27ac peaks within T-cell super-enhancers. Bar plot shows overlap of PICS SNPs with H3K27ac peaks in super-enhancers in CD4+ T-cells, compared to random SNPs drawn from within the same super-enhancers (All CD4+; left bar graph). Adjacent bars show overlap to H3K27ac peaks within CD4+ T-cell super-enhancers that do (Stim) or do not (Unstim) increase their acetylation upon stimulation.
Extended Data Figure 8
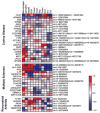
Extended Data Figure 8. Expression Pattern of Genes with PICS Autoimmunity Coding SNPs
Heatmap shows the relative expression levels of genes with coding SNPs associated with Crohn’s disease, multiple sclerosis, and rheumatoid arthritis.
Extended Data Figure. 9
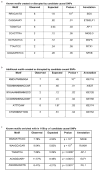
Extended Data Figure. 9. Motifs Directly Altered by or Adjacent to Candidate Causal SNPs
(a) Known motifs (identified by conservation or SELEX) created or disrupted by candidate causal SNPs at a higher frequency than expected by chance when compared to control SNPs drawn from the same loci. (b) Additional motifs, identified by conservation, created or disrupted by candidate causal SNPs more frequently than by chance. (c) Known motifs significantly enriched within 100bp of candidate causal SNPs, compared to background control SNPs drawn from the same loci.
Extended Data Figure 10
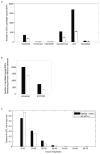
Extended Data Figure 10. Enrichment of Candidate Causal eQTL SNPs in Functional Elements
(a) PICS was used to identify candidate causal SNPs for 4136 eQTL signals in peripheral blood. Bar plot show their overlap with indicated functional genic annotations. Background expectation was calculated based on frequency-matched control SNPs drawn from within 50kb of the candidate causal SNPs. (b) Overlap of candidate causal eQTL SNPs with immune enhancers and promoters, versus background. (c) Magnitudes of disease-associated eQTLs compared to the space of all eQTLs. Histogram compares the magnitudes of PICS eQTL SNPs that overlap PICS autoimmunity SNPs against the full set of PICS eQTL SNPs.
Figure 1
Figure 1. Genetic fine-mapping of human disease
a, GWAS catalog loci were clustered to reveal shared genetic features of common human diseases and phenotypes. Color scale indicates correlation between phenotypes (high=red, low=blue). b, Association signal to MS for SNPs at the IFI30 locus. c, Scatter plot of SNPs at the IFI30 locus demonstrates the linear relationship between LD distance (r2) to rs1154159 (red) and association signal. d, Candidate causal SNPs were predicted for 21 autoimmune diseases using PICS. Histogram indicates genomic distance (bp) between PICS Immunochip lead SNPs and GWAS catalog index SNPs. e, Histogram indicates number of candidate causal SNPs per GWAS signal needed to account for 75% of the total PICS probability for that locus. f, Plot shows correspondence of PICS SNPs to indicated functional elements, compared to random SNPs from the same loci (error bars indicate standard deviation from 1000 iterations using locus-matched control SNPs).
Figure 2
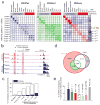
Figure 2. Epigenetic fine-mapping of enhancers
a, Heatmaps show H3K27ac and H3K4me1 signals for 1000 candidate enhancers (rows) in 12 immune cell types (columns). Enhancers are clustered by the cell type-specificity of their H3K27ac signals. Adjacent heatmap shows average RNA-seq expression for the genes nearest to the enhancers in each cluster. Gray-scale (right) depicts the enrichment of PICS autoimmunity SNPs in each enhancer cluster (hypergeometric p-values calculated based on the number of PICS SNPs overlapping enhancers from each cluster, relative to random SNPs from the same loci). The AP-1 motif is over-represented in enhancers preferentially marked in stimulated T-cells, compared to naïve T-cells. b, Candidate causal SNPs displayed along with H3K27ac and RNA-seq signals at the PTGER4 locus. A subset of enhancers with disease variants (shaded) shows evidence of stimulus-dependent eRNA transcription. c, Stacked bar graph indicates percentage overlap with immune enhancers and coding sequence for PICS SNPs at different probability thresholds, compared to control SNPs drawn from the entire genome (All SNPs) or the same loci (Locus CTRL). d, Venn diagram compares PICS SNPs to GWAS catalog SNPs with indicated r2 thresholds. e, Bar graph indicates percentage overlap with annotated T-cell enhancers for PICS SNPs, GWAS SNPs at indicted thresholds, locus control SNPs, and three subsets of SNPs defined and shaded as in panel d.
Figure 3
Figure 3. Cell-type specificity of human diseases
Heatmap depicts enrichment (red=high; blue=low) of PICS SNPs for 39 diseases/traits in acetylated cis-regulatory elements of 33 different cell types.
Figure 4
Figure 4. Disease variants map to discrete elements in super-enhancers
a, Candidate causal SNPs for autoimmune diseases are displayed along with H3K27ac, RNA-seq and TF binding profiles for the IL2RA locus, which contains a super-enhancer (pink shade). b, For all SNPs in the IL2RA locus, scatter plot compares strength of association with MS versus autoimmune thyroiditis. Immunochip data resolve rs706779 (red) as the lead SNP for autoimmune thyroiditis and rs2104286 (blue) as the lead SNP for MS. c, LD matrix displaying r2 between lead SNPs for different diseases at the IL2RA locus confirms distinct and independent genetic associations within the super-enhancer.
Figure 5
Figure 5. Causal variants map to regions of TF binding
a, Plot depicts composite H3K27ac and DNase signals in immune cells over PICS autoimmunity SNPs. PICS SNPs overall coincide with nucleosome-depleted, hypersensitive sites, indicative of TF binding. b, Bar plot indicates TFs whose binding is enriched near PICS SNPs for all 21 autoimmune diseases. Heatmap depicts enrichment of these TFs near variants associated with specific diseases (red:high; blue:low). c, H3K27ac, DNaseI and conservation signals, and selected TF binding intervals are shown in a SMAD3 intronic locus. rs17293632, a noncoding candidate causal SNP for Crohn’s disease, disrupts a conserved AP-1 binding motif in an enhancer marked by H3K27ac in CD14+ monocytes. Summing of ChIP-seq reads overlapping the SNP in the heterozygous HeLa cell line shows that only the intact motif binds AP-1 TFs, Jun and Fos. d, Bar graph shows the fraction of PICS SNPs (black) versus random SNPs from the same locus (white) that create or disrupt one of the significantly enriched motifs, any Selex motif, or any conserved K-mer. Error bars indicate standard deviation from 1000 iterations using locus-matched control SNPs.
Figure 6
Figure 6. Functional Effects of Disease Variants on Gene Expression
a, Pie charts show the fraction of PICS autoimmunity SNPs (left) or peripheral blood eQTLs (right) explained by the indicated genomic features. b, GWAS signal for MS risk at the IKZF3 locus. The minor allele of rs12946510 (red) is associated with both disease risk and eQTL effect (decreased IKZF3 expression), while the minor allele of rs907091 (blue) scored as eQTL only (increased IKZF3 expression). c, eQTL association signal for IKZF3 shown for the same regions as in b. d, H3K27ac, DNaseI and conservation signals, and selected TF binding intervals are shown in the vicinity of rs12946510, which occurs in a conserved site marked by H3K27ac in multiple cell types, including CD20+ B-cells, and bound by multiple TFs. The C/T variation at this SNP does not disrupt any clearly defined DNA motif, but coincides with a degenerate MEF2 motif.

Comment in

Similar articles

Cited by

References

    1. Altshuler D, Daly MJ, Lander ES. Genetic mapping in human disease. Science. 2008;322:881–888. doi: 10.1126/science.1156409. - DOI - PMC - PubMed
    1. Hindorff LA, et al. Potential etiologic and functional implications of genome-wide association loci for human diseases and traits. Proceedings of the National Academy of Sciences of the United States of America. 2009;106:9362–9367. doi: 10.1073/pnas.0903103106. 0903103106 [pii] - DOI - PMC - PubMed
    1. Vyse TJ, Todd JA. Genetic analysis of autoimmune disease. Cell. 1996;85:311–318. - PubMed
    1. Buckner JH. Mechanisms of impaired regulation by CD4(+)CD25(+)FOXP3(+) regulatory T cells in human autoimmune diseases. Nature reviews. Immunology. 2010;10:849–859. doi: 10.1038/nri2889. - DOI - PMC - PubMed
    1. Browning JL. B cells move to centre stage: novel opportunities for autoimmune disease treatment. Nature reviews. Drug discovery. 2006;5:564–576. doi: 10.1038/nrd2085. - DOI - PubMed

Publication types