

Integrating functional data to prioritize causal variants in statistical fine-mapping studies
- PMID: 25357204
- PMCID: PMC4214605
- DOI: 10.1371/journal.pgen.1004722
Integrating functional data to prioritize causal variants in statistical fine-mapping studies
Abstract
Standard statistical approaches for prioritization of variants for functional testing in fine-mapping studies either use marginal association statistics or estimate posterior probabilities for variants to be causal under simplifying assumptions. Here, we present a probabilistic framework that integrates association strength with functional genomic annotation data to improve accuracy in selecting plausible causal variants for functional validation. A key feature of our approach is that it empirically estimates the contribution of each functional annotation to the trait of interest directly from summary association statistics while allowing for multiple causal variants at any risk locus. We devise efficient algorithms that estimate the parameters of our model across all risk loci to further increase performance. Using simulations starting from the 1000 Genomes data, we find that our framework consistently outperforms the current state-of-the-art fine-mapping methods, reducing the number of variants that need to be selected to capture 90% of the causal variants from an average of 13.3 to 10.4 SNPs per locus (as compared to the next-best performing strategy). Furthermore, we introduce a cost-to-benefit optimization framework for determining the number of variants to be followed up in functional assays and assess its performance using real and simulation data. We validate our findings using a large scale meta-analysis of four blood lipids traits and find that the relative probability for causality is increased for variants in exons and transcription start sites and decreased in repressed genomic regions at the risk loci of these traits. Using these highly predictive, trait-specific functional annotations, we estimate causality probabilities across all traits and variants, reducing the size of the 90% confidence set from an average of 17.5 to 13.5 variants per locus in this data.
Conflict of interest statement
The authors have declared that no competing interests exist.
Figures
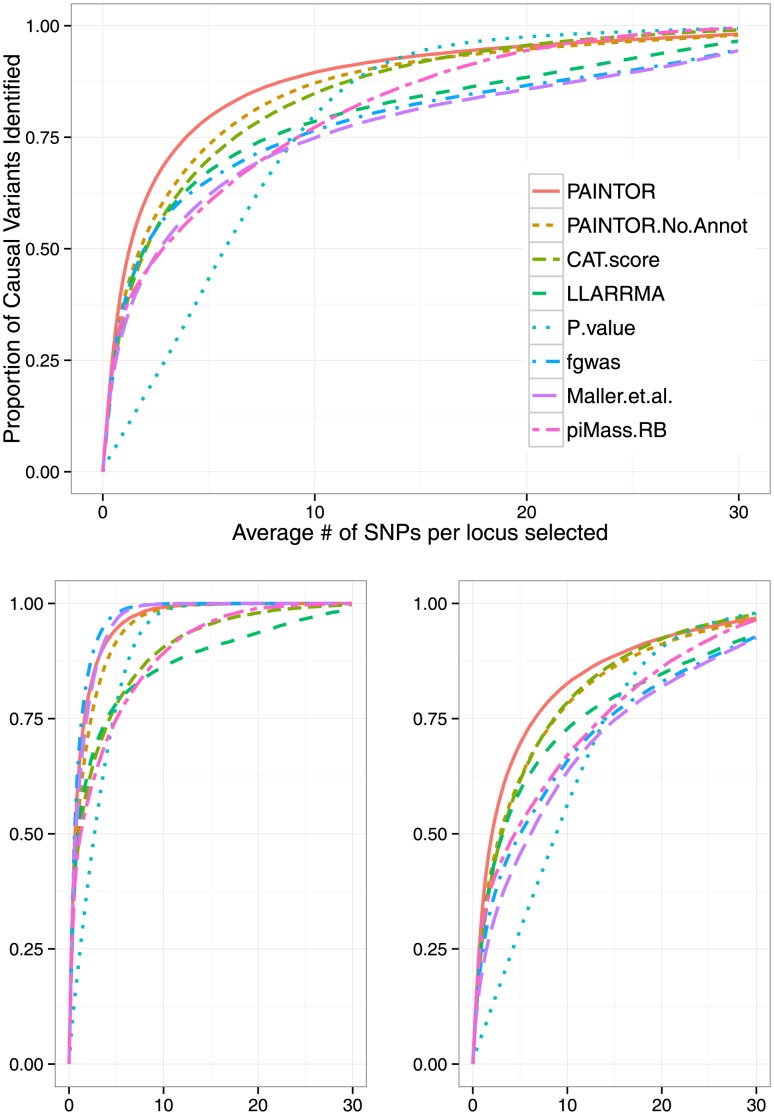
 and repeated the simulation 500 times. The top figure corresponds to the overall performance at causal loci (64 loci) with PAINTOR clearly achieving the greatest overall accuracy. The bottom figures correspond to loci with a single causal variant (an average of 34 per simulation) (left) or multiple causal variants (average of 30 per simulation) (right). At loci where there is one true causal variant, fgwas achieves greater accuracy than PAINTOR due to the fact that fgwas assumes the correct number of causal variants. We note that the version of PAINTOR that assumes a single causal variant yields very similar to fgwas at loci where the truth is of a single causal (both requiring 2.63 SNPs per locus to identify 90% of the causal variants.) However, at loci with multiple causal variants, the power of methods that assume a single causal is greatly deflated leading to PAINTOR's superior overall accuracy.
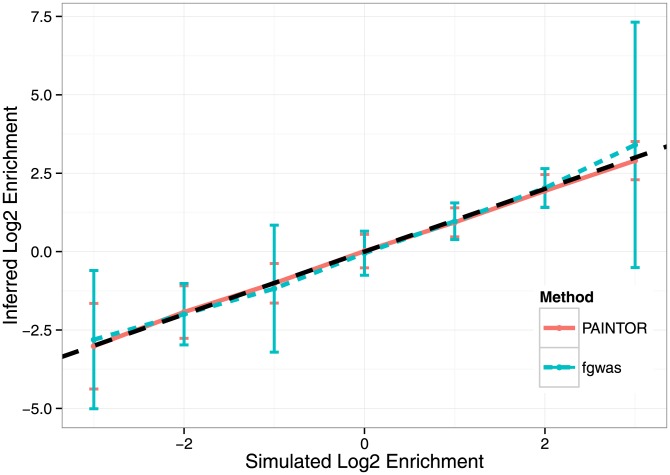
 ), we simulated with annotation effect sizes such that in expectation, we attained approximately 100 causal variants while maintaining enrichment at a fixed point. We used the standard simulation parameters, fixing the variance explained by these 100 loci to 0.25 and using
  genotypes. We discarded simulations where fgwas failed to converge (see Methods). Displayed here are the mean inferred Log2 enrichment estimates (
 1 SD) that were conducted over 500 independent simulations at each enrichment level.
Similar articles
-
Fine-mapping genetic associations.Hum Mol Genet. 2020 Sep 30;29(R1):R81-R88. doi: 10.1093/hmg/ddaa148. Hum Mol Genet. 2020. PMID: 32744321 Free PMC article. Review.
-
Improved methods for multi-trait fine mapping of pleiotropic risk loci.Bioinformatics. 2017 Jan 15;33(2):248-255. doi: 10.1093/bioinformatics/btw615. Epub 2016 Sep 22. Bioinformatics. 2017. PMID: 27663501 Free PMC article.
-
The flashfm approach for fine-mapping multiple quantitative traits.Nat Commun. 2021 Oct 22;12(1):6147. doi: 10.1038/s41467-021-26364-y. Nat Commun. 2021. PMID: 34686674 Free PMC article.
-
ANNORE: genetic fine-mapping with functional annotation.Hum Mol Genet. 2021 Dec 17;31(1):32-40. doi: 10.1093/hmg/ddab210. Hum Mol Genet. 2021. PMID: 34302344 Free PMC article.
-
From genome-wide associations to candidate causal variants by statistical fine-mapping.Nat Rev Genet. 2018 Aug;19(8):491-504. doi: 10.1038/s41576-018-0016-z. Nat Rev Genet. 2018. PMID: 29844615 Free PMC article. Review.
Cited by
-
Insights from GWAS: emerging landscape of mechanisms underlying complex trait disease.BMC Genomics. 2015;16 Suppl 8(Suppl 8):S4. doi: 10.1186/1471-2164-16-S8-S4. Epub 2015 Jun 18. BMC Genomics. 2015. PMID: 26110739 Free PMC article.
-
Genome wide study of tardive dyskinesia in schizophrenia.Transl Psychiatry. 2021 Jun 8;11(1):351. doi: 10.1038/s41398-021-01471-y. Transl Psychiatry. 2021. PMID: 34103471 Free PMC article.
-
MESuSiE enables scalable and powerful multi-ancestry fine-mapping of causal variants in genome-wide association studies.Nat Genet. 2024 Jan;56(1):170-179. doi: 10.1038/s41588-023-01604-7. Epub 2024 Jan 2. Nat Genet. 2024. PMID: 38168930
-
Finemap-MiXeR: A variational Bayesian approach for genetic finemapping.PLoS Genet. 2024 Aug 15;20(8):e1011372. doi: 10.1371/journal.pgen.1011372. eCollection 2024 Aug. PLoS Genet. 2024. PMID: 39146375 Free PMC article.
-
Fine-mapping genetic associations.Hum Mol Genet. 2020 Sep 30;29(R1):R81-R88. doi: 10.1093/hmg/ddaa148. Hum Mol Genet. 2020. PMID: 32744321 Free PMC article. Review.
References
Publication types
MeSH terms
Grants and funding
LinkOut - more resources
Full Text Sources
Other Literature Sources
