. 2014 Oct 29;34(44):14633-43.
doi: 10.1523/JNEUROSCI.1837-14.2014.

Maturational conversion of dendritic early endosomes and their roles in L1-mediated axon growth

Affiliations

Maturational conversion of dendritic early endosomes and their roles in L1-mediated axon growth

Zofia M Lasiecka et al. J Neurosci. .

Abstract

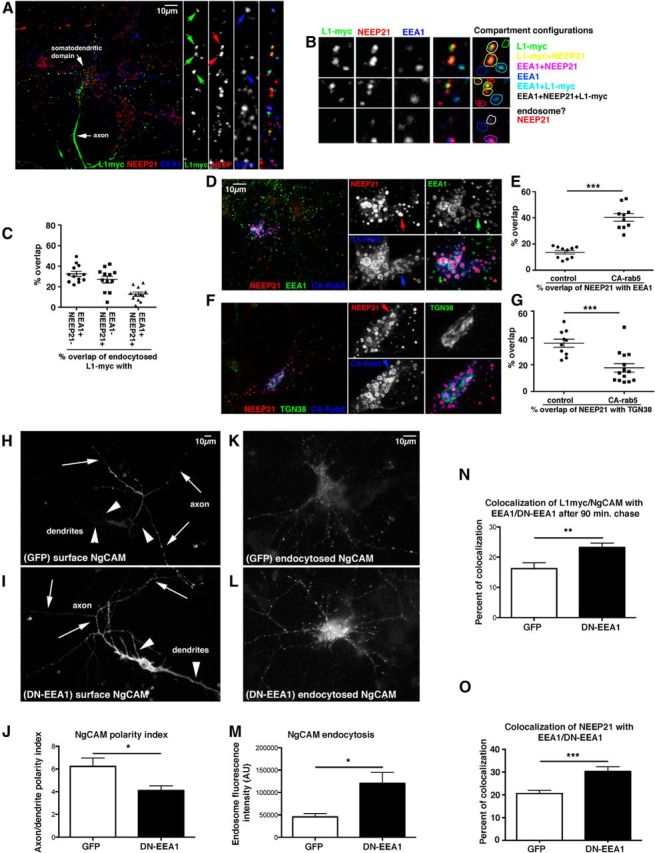
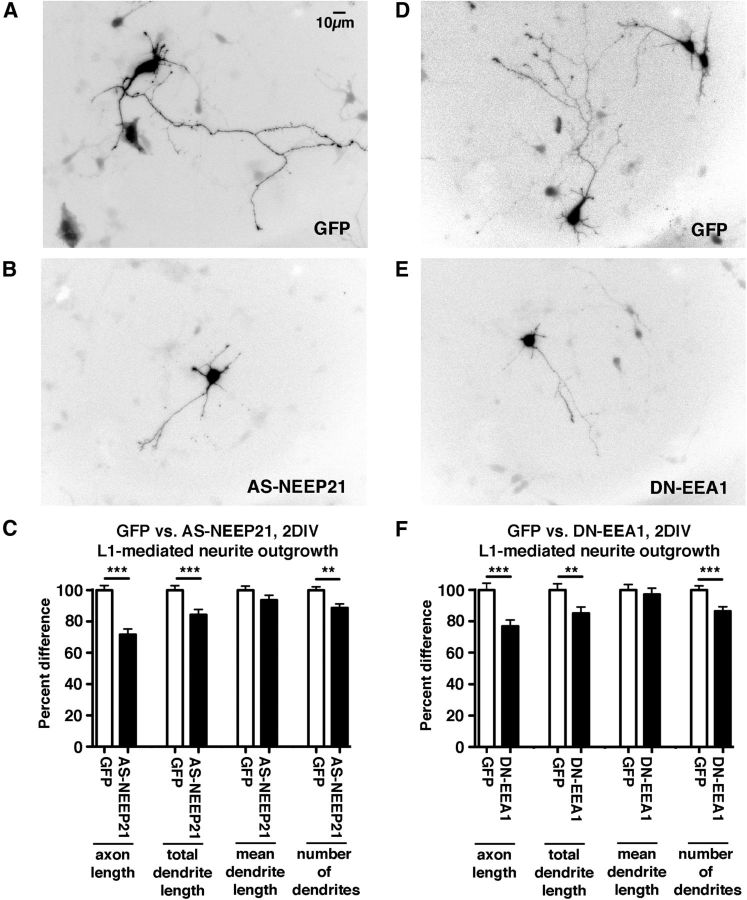
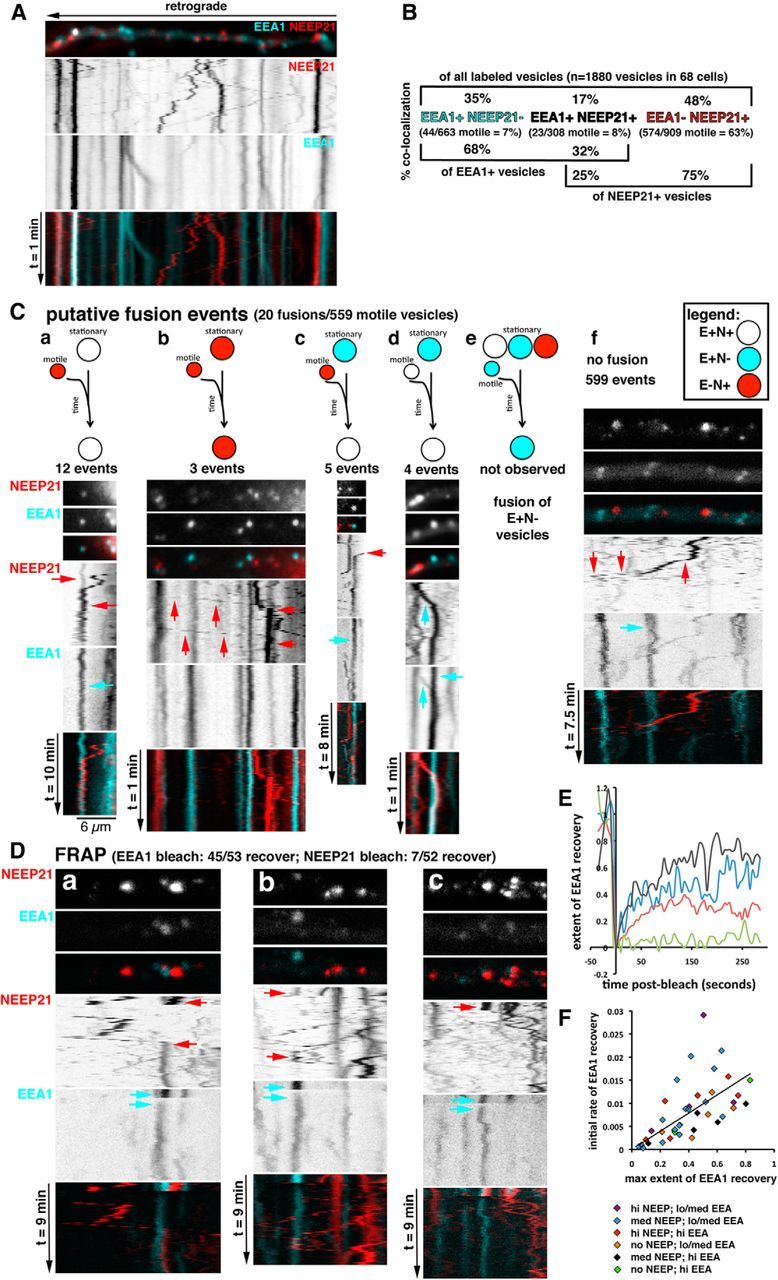
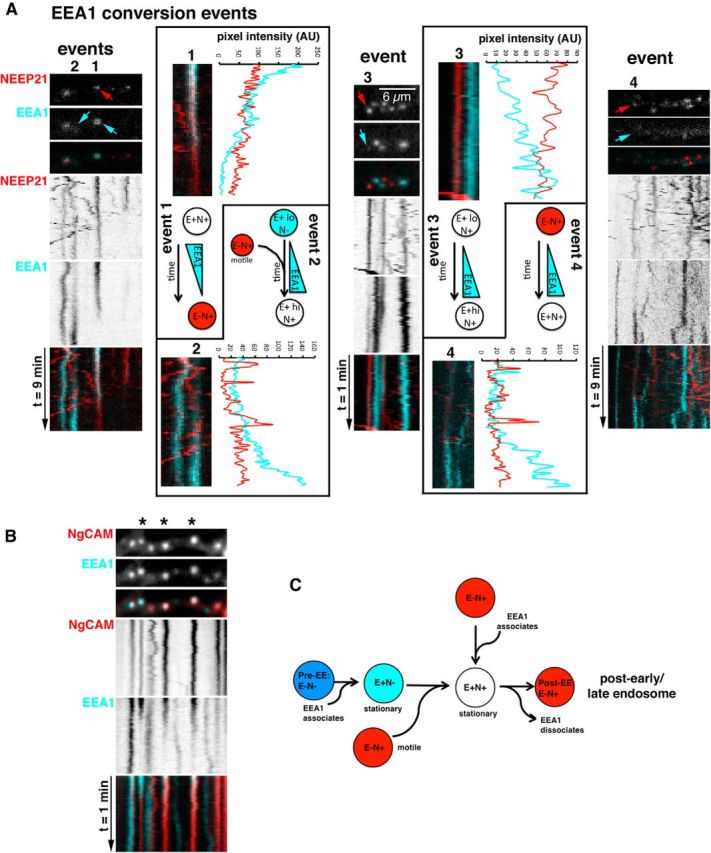
The function of endosomes is intricately linked to cellular function in all cell types, including neurons. Intriguingly, neurons express cell type-specific proteins that localize to endosomes, but little is known about how these neuronal proteins interface with canonical endosomes and ubiquitously expressed endosomal components, such as EEA1 (Early Endosomal Antigen 1). NEEP21 (Neuronal Early Endosomal Protein 21 kDa) localizes to somatodendritic endosomes, and downregulation of NEEP21 perturbs the correct trafficking of multiple receptors, including glutamate receptors (GluA2) during LTP and amyloidogenic processing of βAPP. Our own work implicated NEEP21 in correct trafficking of the axonal cell adhesion molecule L1/neuron-glia cell adhesion molecule (NgCAM). NEEP21 dynamically localizes with EEA1-positive early endosomes but is also found in EEA1-negative endosomes. Live imaging reveals that NEEP21-positive, EEA1-negative endosomes arise as a consequence of maturational conversion of EEA1/NEEP21 double-positive endosomes. Interfering with EEA1 function causes missorting of L1/NgCAM, axon outgrowth defects on the L1 substrate, and disturbance of NEEP21 localization. Last, we uncover evidence that functional interference with NEEP21 reduces axon and dendrite growth of primary rat hippocampal neurons on L1 substrate but not on N-cadherin substrate, thus implicating endosomal trafficking through somatodendritic early endosomes in L1-mediated axon growth.

Keywords: NEEP21; NgCAM; Nsg-1; endosomes; live imaging; trafficking.


Figures

Figure 1.
Figure 1.
EEA1 interference leads to missorting of L1/NgCAM. A–C, EEA1-negative/NEEP21-positive compartments are endosomes. Neurons were transfected with L1-myc, and endocytosis assays were performed with anti-myc antibodies for 20 min. Endocytosed L1-myc was detected with secondary antibodies (green) and counterstained against NEEP21 (red) and EEA1 (blue). A, Overview of one neuron and zoom of a single dendrite. Single channels and triple merges are shown in the side panels. Examples of compartments are shown in detail in B. The overlap of markers is color coded on the right. C, The percentage of overlap of L1-myc with E+N+, E−/N+, and E+/N− endosomes was quantified. A scatter plot of individual cell counts is plotted, with means and SEM indicated. Twelve cells were analyzed. D–G, NEEP21 accumulates in enlarged endosomes induced by expression of constitutively active (CA)-rab5. Neurons were transfected with GFP-CA-rab5 (blue) or soluble GFP (control; data not shown) for 24 h, and then fixed and stained against NEEP21 (red) and EEA1 (D, green) or TGN38 (F, green). Single channels and a triple-stained merged image of one soma are shown enlarged in the side panels. Colocalization of NEEP21 with EEA1 (E) or TGN38 (G) was quantified and plotted in a scatter plot showing individual cells, as well as mean and SEM. Student's t test, p < 0.0001. Ten cells per condition were analyzed. H–J, EEA1 interference leads to missorting of surface NgCAM. Neurons were transfected with NgCAM and either GFP as control (H) or GFP-EEA1-DN (I) for 24 h, and then surface NgCAM was stained in nonpermeabilized cells after fixation. Arrows indicate axons, and arrowheads indicate dendrites. The average NgCAM surface staining intensity was determined for GFP-transfected cells (n = 24 cells) and GFP-DN-EEA1 (n = 38 cells) along the axon and dendrites, and the axon/dendrite polarity index was calculated (J). Bar indicates the SEM. *p < 0.01, Student's t test. One representative experiment is shown (from a total of three independent experiments). K–N, Endocytosed NgCAM accumulates in somatodendritic endosomes when EEA-DN is coexpressed. Neurons were transfected with NgCAM and either GFP as control (K) or GFP-EEA1-DN (L) for 24 h and anti-NgCAM antibody was fed to live cells for 20 min. Endocytosed NgCAM was detected with a secondary antibody after acid stripping of surface-bound antibody. The extent of endocytosed NgCAM in somatic endosomes was quantified (M). N = 47 cells (GFP), 51 cells (EEA1-DN). Bar indicates the SEM. *p < 0.01, Student's t test. One representative experiment is shown (from a total of three independent experiments). N, Endocytosed L1-myc accumulated significantly in EEA1-positive endosomes after 90 min of endocytosed L1-myc antibody chase. N = 21 cells (GFP), and N = 34 cells (DN-EEA1). Bar indicates the SEM. **p < 0.001 Student's t test. One representative experiment is shown (from a total of three independent experiments). O, Overexpression of GFP-EEA1-DN in neurons caused increased accumulation of NEEP21 in EEA1 endosomes. N = 17 cells (GFP), and N = 12 cells (DN-EEA1). Bar indicates the SEM. ***p < 0.0001, Student's t test.
Figure 2.
Figure 2.
Interference with EEA1 or NEEP21 results in decreased axon and dendrite growth. A–C, Downregulation of NEEP21 results in decreased axon and dendrite growth on L1-Fc. Freshly dissociated hippocampal neurons were electroporated with GFP (A) or GFP-AS-NEEP21 (B) and plated on L1-Fc-coated coverslips. The length of the longest process (“axon length”), the combined length of all minor processes (“total dendrite length”), the average dendrite length (“mean dendrite length”), and the number of primary dendrites were measured (after 2 d in culture) and were normalized to control values for easier comparison (C). A total of 190–360 cells were quantified (five independent experiments). Bar indicates the SEM. **p < 0.001; ***p < 0.0001. D–F, Expression of GFP-EEA1-DN results in decreased axon and dendrite growth on L1-Fc. Freshly dissociated cortical neurons were electroporated with GFP (D) or GFP-EEA1-DN (E), and were plated on L1-Fc-coated coverslips. The length of the longest process (“axon length”), the combined length of all minor processes (“total dendrite length”), the average dendrite length (“mean dendrite length”), and the number of primary dendrites were measured (F). A total of 157–187 cells were quantified (three independent experiments). Bar indicates the SEM. **p < 0.001, ***p < 0.0001.
Figure 3.
Figure 3.
Live imaging of EEA1- and NEEP21-positive endosomes in dendrites reveals putative fusion events and differential stability of EEA1 on endosomes. A, Live imaging was performed in cultured neurons transfected for 24 h with GFP-EEA1 (turquoise) and NEEP21-mCherry (red). Kymographs were prepared from the movies, and one dendrite is shown as an example. A still frame from the movie is shown on top with the direction of retrograde movement indicated by an arrow. Single channels are shown as inverted black-and-white images on top of the merged kymographs (see Movie 1). Quantification of colocalization of all labeled endosomes, and separately for motile endosomes, is shown in B. The brackets at the bottom of the graph show the quantification of colocalization, whether the point of view of one marker is taken rather than that of all stained endosomes. C, Kymographs of live imaging in GFP-EEA1/NEEP21-mcherry-expressing neurons were analyzed for putative fusion events. Putative fusion events were rare (20 of 559 motile vesicles). The kinds of putative fusion events are indicated by the diagram: red = E−/N+ vesicle; turquoise = E+/N− vesicle; white = E+N+ vesicle. Kymographs illustrating an example of each case are shown below the diagrams: 12 events of E−/N+ vesicle undergoing putative fusion with stationary E+N+ (a); (b) 3 events of E−/N+ vesicle undergoing putative fusion with stationary E−/N+ (b); 5 events of E−/N+ vesicle undergoing putative fusion with stationary E+/N− (c); 4 events of E+N+ vesicle undergoing putative fusion with stationary E+/N− (d); no events of motile E+/N− vesicles fusing (e); and example of motile NEEP21-vesicle moving past stationary endosomes unimpeded (f). D, FRAP experiments were performed on neurons expressing GFP-EEA1 and NEEP21-mcherry. Arrows indicate the bleach event and the recovery event. a–c, Examples of different post-FRAP behaviors. Movie 2 corresponds to the dendrite shown in a. E, GFP-EEA1 recovery after FRAP was extensive (45 of 53 recovered). GFP-EEA1 recovery was quantified after FRAP, and four examples of GFP-EEA1 recovery are plotted. The black line exemplifies one of the highest observed recoveries. The green line exemplifies one of the low/no recoveries. The blue and red lines are intermediate in recovery. F, The maximal recovery extent correlates positively with the initial rate of recovery. No correlation was found with the recovery rate or extent of recovery based on how much GFP-EEA1 or NEEP21-mCherry were initially present on the endosome before the FRAP. Color coding is indicated.
Figure 4.
Figure 4.
EEA1 dynamically associates and dissociates from NEEP21 endosomes. A, Kymographs of GFP-EEA1/NEEP21-mCherry-expressing neurons show that events were EEA1 associates or dissociates from endosomes (“conversion events”). Examples of the kinds of conversion events are illustrated and are numbered 1–4 above the observed endosome (marked with arrows). For each example, a zoomed-in closeup of the converting endosome is shown together with a diagram illustrating the observed conversion and an intensity scan of the conversion event. B, EEA1 conversion events can be observed on endosomes containing endocytosed NgCAM. Stars above the kymograph indicate the EEA1-containing endosomes, which show conversion to EEA1-negative, NgCAM+ endosomes (Movie 3). C, Endosomal maturation of EEA1-positive endosomes in dendrites. We propose a model in which E+N+ endosomes can arise by the following two pathways: EEA1 associates with E−/N+ endosomes; and/or motile E−/N+ vesicles fuse with EEA1+ endosomes. E+N+ endosomes can convert to E−/N+ endosomes by dissociation of EEA1 to result in post-EE E−/N+ endosomes.

Similar articles

Cited by

References

    1. Alberi S, Boda B, Steiner P, Nikonenko I, Hirling H, Muller D. The endosomal protein NEEP21 regulates AMPA receptor-mediated synaptic transmission and plasticity in the hippocampus. Mol Cell Neurosci. 2005;29:313–319. doi: 10.1016/j.mcn.2005.03.011. - DOI - PubMed
    1. Davidson HT, Xiao J, Dai R, Bergson C. Calcyon is necessary for activity-dependent AMPA receptor internalization and LTD in CA1 neurons of hippocampus. Eur J Neurosci. 2009;29:42–54. doi: 10.1111/j.1460-9568.2008.06563.x. - DOI - PMC - PubMed
    1. Ha J, Lo KW, Myers KR, Carr TM, Humsi MK, Rasoul BA, Segal RA, Pfister KK. A neuron-specific cytoplasmic dynein isoform preferentially transports TrkB signaling endosomes. J Cell Biol. 2008;181:1027–1039. doi: 10.1083/jcb.200803150. - DOI - PMC - PubMed
    1. Hoogenraad CC, Popa I, Futai K, Martinez-Sanchez E, Wulf PS, van Vlijmen T, Dortland BR, Oorschot V, Govers R, Monti M, Heck AJ, Sheng M, Klumperman J, Rehmann H, Jaarsma D, Kapitein LC, van der Sluijs P. Neuron specific Rab4 effector GRASP-1 coordinates membrane specialization and maturation of recycling endosomes. PLoS Biol. 2010;8:e1000283. doi: 10.1371/journal.pbio.1000283. - DOI - PMC - PubMed
    1. Lasiecka ZM, Winckler B. Mechanisms of polarized membrane trafficking in neurons—focusing in on endosomes. Mol Cell Neurosci. 2011;48:278–287. doi: 10.1016/j.mcn.2011.06.013. - DOI - PMC - PubMed

Publication types

LinkOut - more resources